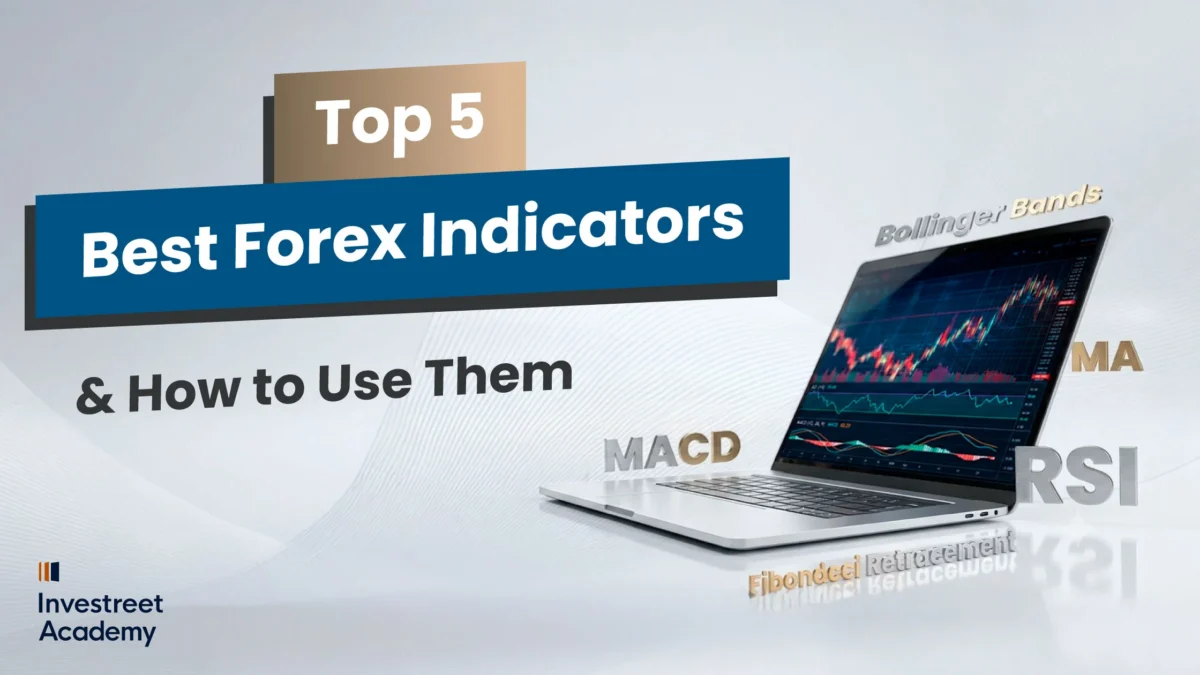
Top 5 Forex Indicators of the Most Commonly Used by Traders
Forex markets move constantly, making it difficult for traders to determine whether prices may continue, reverse, or slow down. To better understand these market movements, traders use various analytical tools, including forex indicators to study trends, momentum, volatility, and key price levels.
Over time, forex indicators became an essential part of technical analysis, helping traders build trading strategies, confirm market signals, and improve decision-making across different market conditions and trading styles.
In this article, we will explore what forex indicators are, their main types, the difference between leading and lagging indicators, and the five most popular forex indicators used by traders. We will also look at their key signals, advantages and disadvantages, common trading mistakes, and how to combine forex indicators and how to use them with fundamental news analysis for more balanced trading decisions.
History glimpse:
Forex indicators evolved from the foundations of technical analysis developed in the late 1800s and early 1900s, as traders sought ways to analyse price movements and identify market trends. Early concepts were heavily influenced by Charles Dow and Dow Theory, which emphasized that markets tend to move in trends.
As financial markets evolved, traders needed more structured tools to analyse price behaviour and support trading decisions. This led to the development of technical indicators, which are now widely used across financial markets, including forex, to help identify trends, momentum, volatility, and potential reversal areas.
Now, let’s understand what forex indicators are and why traders use them in forex markets.
What are Forex Indicators?
Forex indicators are tools used by traders to analyse price movements, market momentum, trend strength, volatility, and potential reversal areas in the forex market.
They are divided into categories based on the market information they analyse. Some identify trends, while others measure momentum, volatility, or trading volume. Together, they help traders better understand market conditions and identify potential trading opportunities.
No single indicator works perfectly on its own. Combining indicators from different categories can help confirm signals and improve analysis.
Why do Traders use Forex Indicators?
- Help in identifying market trends, momentum, and overall price direction.
- Spot potential reversals, support and resistance levels, and overbought or oversold conditions.
- Measure market volatility and confirm trade setups, entries, and exits.
- Help support risk management and reduce emotional trading decisions.
- Support different trading styles and provide more objective market analysis when combined with price action and fundamental analysis.
Forex indicators are grouped into different categories based on the type of market information they measure. Each type helps traders analyse market behaviour from a different perspective.
What are the Different Categories of Forex Indicators?
- Trend indicators: Used to identify the overall market direction and whether a trend is strengthening or weakening.
Example: Moving Average, MACD
- Momentum indicators: Measure the speed and strength of price movements, helping traders spot strong or weakening momentum.
Example: Relative Strength Index (RSI), Stochastic Oscillator, MACD.
- Volatility indicators: Show how much the market is expanding or contracting in price movement, often helping identify breakout conditions.
Example: Bollinger Bands, Average True Range (ATR).
- Support and Resistance or Price level indicators: help identify key price zones where reversals, reactions, or breakouts may occur.
Example: Fibonacci Retracement, Pivot Points.
- Volume indicators: Analyse trading volume to confirm trend strength or detect buying and selling pressure.
Example: On-Balance Volume (OBV).
Not all forex indicators work the same way, some aim to anticipate potential market moves, while others focus on confirming trends that are already in progress, that’s why some indicators are considered leading and some lagging.
What is the Difference Between Leading and Lagging Forex Indicators?
Leading indicators: Aim to signal potential price movements before a trend or reversal fully develops. They are mainly used to anticipate market moves and help traders spot possible early entry or exit opportunities before the broader market direction becomes clear.
Example:
Relative Strength Index (RSI), Stochastic Oscillator, Fibonacci Retracement.
Lagging indicators: Confirm trends after price movements have already started. They are commonly used to identify and follow existing market trends, helping traders confirm whether momentum and trend direction remain strong.
Example:
Moving Average, MACD.
So, simply leading indicators aim to anticipate potential price movements, while lagging indicators help confirm existing trends.
After understanding what forex indicators are, why traders use them, and their different types, let’s explore the five most popular forex indicators and their commonly used signals.
What are the 5 Most Popular Forex Indicators?
There are many forex indicators used by traders, each designed to analyse different aspects of price movement and market behaviour. We will shed light on five of the most popular and widely used technical indicators among traders: the Relative Strength Index (RSI), Moving Average Convergence Divergence (MACD), Moving Averages (MA), Bollinger Bands, and Fibonacci Retracement.
Before exploring these indicators, it is important to note that no forex indicator should be treated as a standalone trading signal. Traders often combine some indicators together with price action, market structure, support and resistance levels, or other confirmation tools to improve trading decisions and reduce false signals.
Also, there is no single timeframe that is best for all forex indicators. Most indicators can be applied across multiple timeframes, with traders typically selecting timeframes based on their trading style and objectives. Shorter timeframes are often used by scalpers and day traders, while longer timeframes are generally preferred by swing and position traders.
Let’s start with one of the most popular momentum indicators in technical analysis, the Relative Strength Index (RSI).
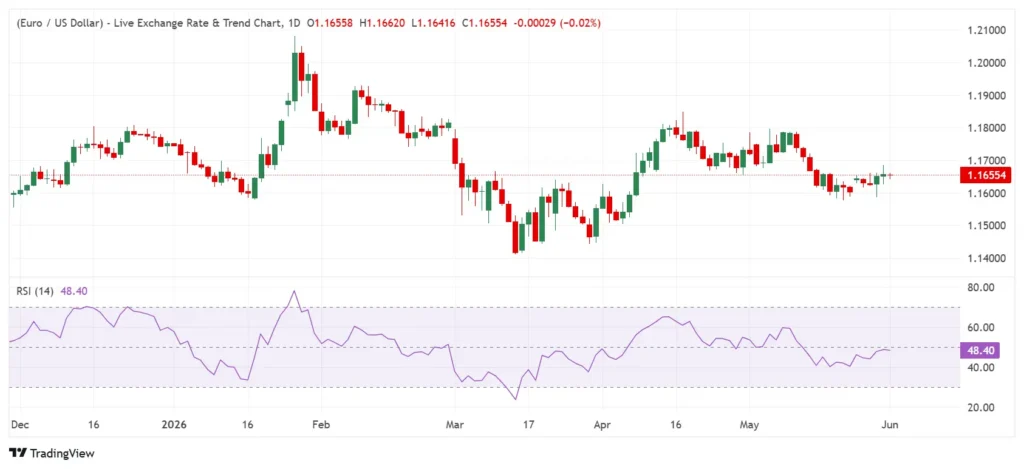
1. Relative Strength Index (RSI):
RSI is a momentum oscillator used to measure the strength and speed of price movements. It is commonly used to identify whether an asset may be overbought or oversold.
RSI works on a scale from 0 to 100, and traders use it to identify potential reversal areas, assess momentum strength, and avoid entering trades after a move may already be overextended.
It tends to work best in ranging (sideways) market conditions, where price moves between support and resistance levels.
The standard setting for the Relative Strength Index (RSI) is 14 periods. This means RSI calculates momentum using the previous 14 candles on the selected timeframe.
For example, on a 1-hour chart, RSI uses the previous 14 hourly candles, while on a daily chart it uses the previous 14 daily candles.
How to use RSI?
Key Signals:
- Overbought or Oversold: RSI above 70 signals the asset is overbought and a pullback may follow while below 30 signals oversold conditions and a potential bounce. These levels may highlight areas where momentum is weakening, but they do not guarantee a reversal.
- Divergence: Price making a new high while RSI forms a lower high signals bearish divergence and weakening bullish momentum. Price is making a new low while RSI forms a higher low signaling bullish divergence and weakening bearish momentum.
- Centreline (50): RSI moving above 50 generally signals bullish momentum, while a move below 50 generally signals bearish momentum. Traders often use the 50 level as a momentum filter to help align trades with the broader trend.
- RSI breakout: Traders draw trendlines and identify support/resistance areas on the RSI. Breaking above resistance or below support can signal strengthening momentum and may appear before price breakouts.
- RSI breakout: Traders can draw trendlines and identify support and resistance levels on the RSI. A breakout above RSI resistance may signal strengthening bullish momentum, while a breakout below RSI support may signal strengthening bearish momentum.
Key tips when using RSI:
- Don’t use RSI alone, combine it with support and resistance levels, candlestick patterns, trend analysis, or other indicators like MACD and Moving Averages for stronger confirmation.
- RSI can remain overbought or oversold for long periods during strong trends, so avoid assuming every signal means an immediate reversal.
- Divergence tends to be more reliable on higher timeframes (H1, H4, and Daily), while lower timeframes may generate more false signals due to market noise.
- Adjust RSI levels in strong trends, some traders use 80/20 instead of 70/30 during strong trends to help filter out false reversal signals.
| Technical Indicators | Pros | Cons |
| RSI | – Helps identify overbought conditions above 70 and oversold conditions below 30. – Helps measure the strength and speed of momentum shifts. – RSI divergence can warn that bullish or bearish momentum is weakening. – The 50 level helps identify whether bullish or bearish momentum is dominant. -Works well in range-bound, sideways markets. | – RSI can remain overbought or oversold for long periods during strong trends. – Divergence may appear too early before price actually reverses. – Frequent false signals can occur in highly volatile markets. |
After exploring how RSI helps measure momentum, let’s move on to Moving Average, one of the most widely used tools for identifying trend direction.
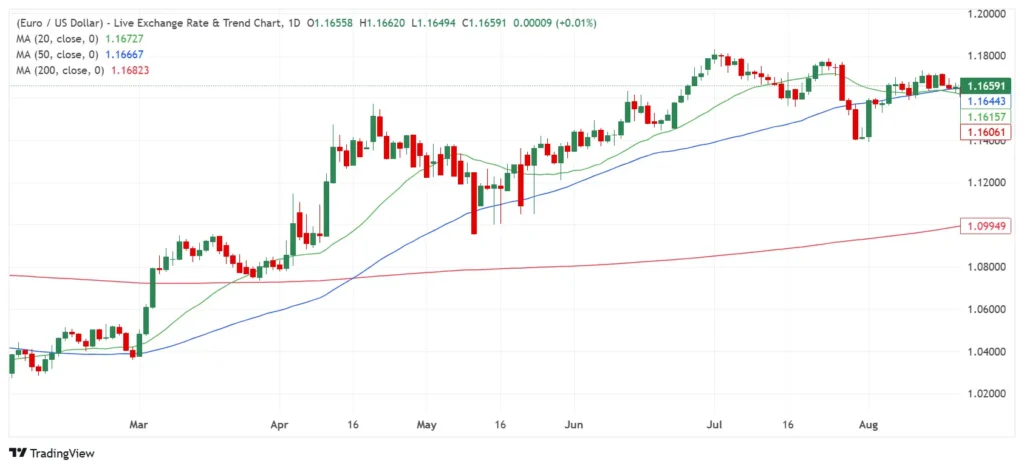
2. Moving Average:
Moving averages (MA) are trend-following indicators and among the most widely used technical indicators in financial markets. They help traders smooth out price fluctuations to identify trend direction.
They appear as smooth lines plotted directly on the price chart, following the overall direction of price movement.
The two most common types are the Simple Moving Average (SMA) and the Exponential Moving Average (EMA).
- Simple Moving Average (SMA): Calculates the average closing price over a specific period, giving equal weight to all prices, making it slower to react to price changes.
Example:
A 50-period SMA calculates the average closing price of the previous 50 candles equally.
- Exponential Moving Average (EMA): Gives more weight to recent prices, making it faster and more responsive to market movements and trend changes. It is preferred by many active traders.
Example:
A 50-period EMA reacts more quickly to recent price changes than a 50-period SMA.
Moving averages generally work best in trending market conditions, where price is moving clearly upward or downward rather than sideways.
MAs are considered lagging indicators because they rely on past price data, so they help confirm trends rather than predict future market movements.
The most popular moving average periods are the 50-period MA, commonly used to identify medium-term trend direction, and the 200-period MA, widely used to identify the long-term trend and potential support or resistance areas.
How to Use Moving Averages?
- Trend identification: Price trading above the moving average may signal an uptrend, showing buyers are in control. Price trading below the moving average may signal a downtrend, showing sellers are in control.
- Dynamic support & resistance: In an uptrend, price often pulls back toward the moving average before continuing higher, so the moving average may act as a support level. In a downtrend, price often rebounds toward the moving average before continuing lower, so the moving average may act as resistance.
- Moving Average crossovers: A Golden Cross occurs when the short-term 50-day MA crosses above the long-term 200-day MA, signalling a potential bullish trend. A Death Cross occurs when the 50-day MA crosses below the 200-day MA, signalling a potential bearish trend.
- Price crossovers: When price breaks and closes above a moving average, it may signal a shift toward an uptrend. When price breaks and closes below a moving average, it may signal a shift toward a downtrend.
Key tips when using Moving Average:
- Use multiple MAs together to see the full trend picture, combining short-term and long-term moving averages can help identify trend strength and crossover signals.
- Match the MA period to your timeframes, shorter MAs react faster and suit short-term trading, while longer MAs are better for identifying long-term trends.
- In choppy or sideways markets MAs can generate a lot of false signals, that’s why moving averages generally work best when the market is clearly trending.
- For stronger confirmation, combine moving average with support & resistance, candlestick patterns and other indicators like RSI and MACD.
| Technical Indicators | Pros | Cons |
| Moving Average | – Helps in identifying the overall market trend direction. – Dynamic support and resistance can help identify pullback entry areas. – Golden Cross and Death Cross signals are widely used and simple. – Smooths price fluctuations to reduce short-term market noise. | – Moving averages are lagging indicators, which can make them less effective for timing precise market entries and exits. – They can generate multiple false signals in range-bound or sideways markets. – Shorter-period moving averages may react too quickly to price fluctuations, while longer-period moving averages may respond too slowly to market changes. |
While Moving Averages help traders identify the overall market trend, let’s move to another popular momentum and trend-following indicator, MACD.
3. MACD (Moving Average Convergence Divergence):
MACD is a trend-following momentum indicator used to identify trend direction, measure momentum strength, and signal potential trend reversals.
It is based on the relationship between moving averages and consists of three main components:
- The MACD line: Calculated by subtracting the 26-period Exponential Moving Average (EMA) from the 12-period EMA.
- The signal line: A 9-period EMA of the MACD line.
- The histogram: Shows the distance between the MACD line and the signal line.
Together, these components help traders evaluate bullish or bearish momentum and overall market direction.
The name “MACD” comes from the convergence and divergence of moving averages. When the moving averages move closer together, momentum may be weakening (convergence). When they move further apart, momentum may be strengthened (divergence).
MACD generally works best in trending market conditions, where price is moving clearly upward or downward rather than sideways, as choppy or low-volatility markets may produce weaker or false signals.

Note:
In the chart above, the blue line represents the MACD line, while the orange line represents the signal line.
How to use MACD?
- MACD line crossover: When the MACD line crosses above the signal line, it may signal strengthening bullish momentum. When the MACD line crosses below the signal line, it may signal strengthening bearish momentum.
- Zero-line crossover: When the MACD crosses above the zero line, it may signal a shift toward a bullish trend and strengthen bullish momentum. When it crosses below the zero line, it may signal a shift toward a bearish trend and strengthen bearish momentum.
- MACD divergence: Price makes a new high while MACD forms a lower high, this may signal a bearish divergence. When price makes a new low while MACD forms a higher low, it may signal a bullish divergence.
- Histogram expansion & contraction: Growing histogram bars may signal strengthening momentum, while a shrinking histogram may signal weakening momentum.
Key tips when using MACD:
- Avoid trading every crossover, especially in sideways markets where false signals are common. Focus on crossovers that align with the overall trend.
- Watch the histogram for early momentum changes, the histogram often starts shrinking before a MACD crossover occurs, which may signal weakening momentum.
- MACD works well with RSI, Moving Averages, support & resistance levels, and candlestick patterns for stronger confirmation.
- Faster settings (e.g., 8,17,9) may suit shorter-term trading, while the default (12,26,9) setting is the most commonly used MACD setting.
| Technical Indicators | Pros | Cons |
| MACD | – Combines trend direction and momentum in one indicator. – MACD crossovers help identify potential momentum shifts for entry and exit clues. – The zero line helps confirm bullish or bearish trend bias. – Histograms make momentum shifts visually obvious. – Works well in trending markets with strong directional movement. | – Because MACD is based on moving averages, signals often lag price action. – Crossovers in sideways markets can create whipsaw signals. – Less effective in choppy market conditions. – As a trend-following indicator, MACD is generally slower at identifying the beginning of a new trend. |
After exploring how MACD helps identify momentum shifts and trend confirmation, let’s move to Bollinger Bands, which are mainly used to measure market volatility and identify potential breakout or reversal areas.
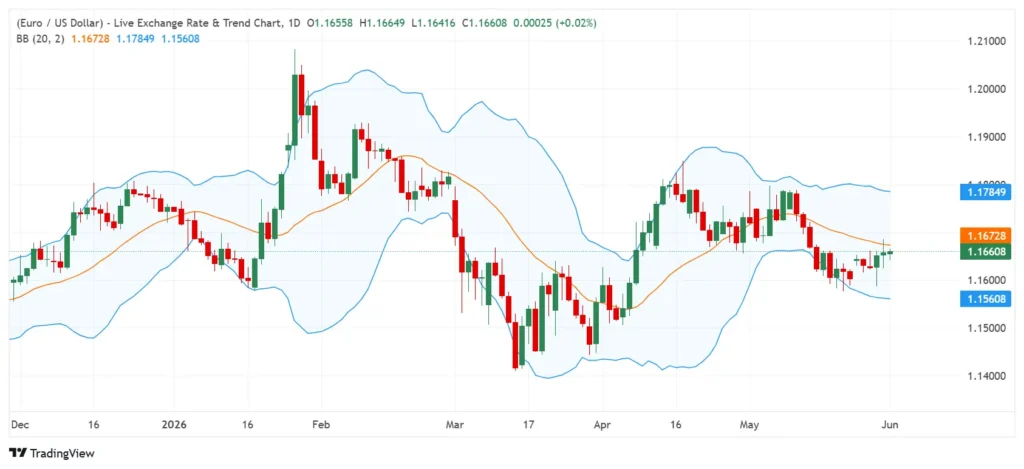
4. Bollinger Bands:
Bollinger Bands are a volatility-based indicator used to measure market volatility and identify whether price is relatively high or low compared to its recent average price over a certain period.
The standard Bollinger Bands setting is 20 periods with 2 standard deviations, meaning the bands are calculated using the last 20 candles on the selected timeframe.
The indicator consists of three bands that expand and contract as market volatility changes:
- Middle band (20-period Simple Moving Average)
- Upper band (Middle band + 2 standard deviations)
- Lower band (Middle band – 2 standard deviations)
As volatility increases, the bands widen, while lower volatility causes the bands to contract.
Bollinger Bands work best in sideways or ranging markets, where price oscillates between the upper and lower bands.
How to use Bollinger Bands?
- Mean reversion: Price often moves back toward the middle band (20-period SMA) after touching or moving outside the upper or lower band, potentially signalling a pullback or temporary reversal.
- Band squeeze: When the bands contract and move closer together, it signals low volatility. A squeeze often precedes a period of increased volatility and a potential breakout in either direction.
- Band breakout: When price breaks above the upper band or below the lower band during expanding bands, it may signal strong momentum. Traders often wait for a candle to close outside the bands to help confirm the breakout direction.
Key tips when using Bollinger Bands:
- Best used alongside RSI or MACD to help confirm whether a touch of the bands is likely to signal a reversal or trend continuation.
- For breakouts, wait for a candle close outside the bands and use other tools to help confirm the breakout direction.
- Bollinger Bands work best in ranging markets, mean reversion signals tend to be more reliable when price touches the upper band near resistance or the lower band near support.
- During strong trends, price can remain near the upper or lower band for extended periods, so a band touch does not necessarily signal a reversal.
| Technical Indicators | Pros | Cons |
| Bollinger Bands | – Dynamically adapts to market volatility. – Bollinger Band squeezes help identify periods of low volatility before expansion. – Useful for identifying mean-reversion opportunities. – Expanding bands help confirm rising market volatility. – Useful for spotting potentially stretched price conditions near outer bands. – Middle band can act as dynamic support or resistance. | – Because Bollinger Bands are built around a 20-period moving average (typically an SMA), they are based on past price data and can lag current market movements, meaning some signals may appear after a trend has already started. – Price can “ride” the upper or lower band for extended periods during strong trends, making it unreliable as a standalone reversal signal. – A band squeeze only tells you that volatility is contracting, it gives no clue about which direction the breakout will go. – In low-volatility environments, the bands narrow so much that nearly every price move touches a band, which can generate false signals. |
While Bollinger Bands help track market volatility and potential breakout conditions, Fibonacci Retracement focuses on identifying potential support and resistance levels where price pullbacks or reversals may occur.
5. Fibonacci:
Fibonacci retracement is a tool used to identify potential support and resistance levels based on the Fibonacci sequence, helping traders pinpoint where price may pause, retrace, or reverse during a trend.
It is based on key Fibonacci ratios derived from the Fibonacci sequence. The most commonly used retracement levels are:
- 23.6%: shallow retracement, seen in very strong trends.
- 38.2%: moderate retracement, common in strong trends.
- 50%: not an official Fibonacci level but widely watched as a key psychological level.
- 61.8%: the “golden ratio,” often considered the most significant and widely watched Fibonacci level.
- 78.6%: a deep retracement level that may signal a strong pullback within a trend.
After a significant price move up or down, markets often retrace, pulling back a portion of that move before continuing in the original direction. Fibonacci retracement levels help identify areas where a pullback may find support or resistance.
A swing high and swing low are the key price points traders use to draw Fibonacci Retracement levels correctly.

Swing high: A temporary peak where price stops moving higher and starts turning downward.
Swing low: A temporary bottom where price stops moving lower and starts turning upward.
In an uptrend, traders draw Fibonacci from the swing low to the swing high to identify potential support levels during a pullback.
In a downtrend, traders draw Fibonacci from the swing high to the swing low to identify potential resistance levels during a rebound.
Example:
If EUR/USD rises from 1.1000 (swing low) to 1.1200 (swing high), traders apply Fibonacci Retracement between these two points to identify potential pullback support levels such as 38.2%, 50%, and 61.8%.
How to use Fibonacci?
- Identify a strong trend
- Draw Fibonacci from swing low to swing high (uptrend) or reverse for a downtrend.
- Wait for price to retrace toward key Fibonacci levels, commonly between 38.2% and 61.8%.
- Look for confirmation (candlestick rejection, structure break, etc…)
- Enter in the direction of the trend.
Key Signals:
- Retracement entry: During an uptrend, a price pulling back to a Fibonacci level and bouncing may signal a potential buying opportunity. During a downtrend, a price rally to a Fibonacci level and rejection may signal a potential selling opportunity.
- Confluence: When a Fibonacci level aligns with another technical factor, such as support or resistance levels, a moving average, trendline, or candlestick pattern, the level may become more significant.
- Trend continuation: If price finds support or resistance at a key Fibonacci level during a pullback, it may signal that the trend remains intact. A decisive break of a key Fibonacci level may indicate a deeper correction or weakening trend.
- Fibonacci extensions: Once a retracement is complete, traders use Fibonacci Extensions to identify potential profit targets. Common extension levels include 127.2%, 161.8%, and 261.8%.
Key Notes:
- Draw Fibonacci correctly; use clear, significant swing highs and lows when drawing Fibonacci levels, as incorrect swing points can lead to misleading levels.
- Treat Fibonacci levels as zones. Fibonacci levels are not guaranteed reversal points; they are zones where price is likely to react, not exact price levels.
- The 61.8% level, known as the Golden Ratio, is one of the most closely watched Fibonacci levels among traders and is often considered the most significant retracement level.
- Look for confluence, Fibonacci levels become more reliable when they align with support and resistance levels, moving averages, trendlines, RSI signals, or candlestick patterns.
| Technical Indicators | Pros | Cons |
| Fibonacci | – Common retracement levels such as 38.2%, 50%, and 61.8% help identify possible pullback zones. – Helps traders estimate potential support and resistance areas within trends. – Widely used for identifying possible entry, stop-loss, and target levels. – Works effectively when combined with trend indicators or price action. | – Swing highs and lows used to draw Fibonacci levels can vary between traders, leading to different retracement levels and interpretations. – During periods of high volatility, price may move through Fibonacci levels without producing meaningful support or resistance reactions. |
After exploring the advantages and disadvantages of each indicator, let’s look at how traders combine forex indicators to build stronger and more reliable trading setups.
Effective Strategies for Combining Forex Indicators
Forex indicators are often combined to help confirm signals rather than relying on a single indicator. The goal is to combine indicators that serve different purposes, such as trend, momentum, volatility, or support and resistance, to help filter out false signals.
- Trend and momentum strategy: Use a Moving Average to identify the trend direction and RSI to confirm momentum. For example, looking for price trading above the Moving Average while RSI remains above 50 may support bullish conditions.
- Trend confirmation strategy: Combine a Moving Average with MACD. For example, look for price trading above the Moving Average while the MACD line crosses above the signal line to confirm bullish momentum.
- Volatility and reversal strategy: Use Bollinger Bands with RSI. Look for potential mean-reversion setups when price touches or breaches the upper or lower Bollinger Band while RSI enters overbought or oversold territory, to identify possible reversal opportunities.
- Fibonacci pullback strategy: Combine Fibonacci Retracement with a Moving Average and price action. Look for price reacting at key Fibonacci levels that align with a Moving Average acting as dynamic support or resistance.
After learning how forex indicators can be combined, it is also important to understand the common mistakes traders make when using them and how these mistakes can affect trading decisions.
What are Common Mistakes When Using Forex Indicators?
- Using multiple forex indicators on a chart at once can create confusion and conflicting analysis rather than improving decision making.
- Ignoring price action confirmation, many traders enter trades based only on indicator signals without confirming them through price action, such as support and resistance reactions, candlestick patterns, or breakout confirmations.
- Not paying attention to market conditions can lead to poor trading decisions, some forex indicators perform better in trending markets, while others work better in ranging or sideways conditions.
- Relying only on technical indicators while ignoring fundamental factors such as economic data, central bank decisions, earnings reports, or geopolitical events can lead to misleading signals, as major news and fundamentals can strongly impact market direction and volatility.
- Using incorrect settings for indicators, settings that are too sensitive may create excessive false signals, while slower settings may delay entries and exits.
- Ignoring risk management and using forex indicators without proper stop-loss and take-profit levels can lead to uninformed decisions and significant trading losses.
How to Trade Forex Indicators With News?
Forex indicators help identify timing and momentum, while news and fundamentals explain the market direction. Combining both helps traders make more balanced trading decisions.
- Identify the technical bias before the news release, using indicators such as Moving Averages, RSI, and MACD to assess trend direction and momentum.
- Compare technical signals with the news outlook, as setups tend to be stronger when they align with market expectations.
- Avoid trading immediately before major news releases, as volatility can trigger false breakouts and unreliable signals.
- Wait for confirmation after the news release to allow volatility to settle before entering trades.
- Adjust risk management during major events, as increased volatility can quickly change market conditions.
After examining some of the most popular forex indicators, their signals, advantages, disadvantages, and how they can be combined, it becomes clear that technical indicators can help traders better analyse market conditions, identify trends, measure momentum, and spot potential trading opportunities. However, no indicator should be used as a standalone trading signal, which is why traders often combine technical indicators with price action, market structure, support and resistance levels, risk management, and fundamental analysis to build stronger and more balanced trading decisions across different market conditions.