
Financial markets move with force, speed, and strength, known as momentum. This concept is crucial for interpreting price behavior, as it shows whether buyers or sellers are in control at any moment.
To make momentum easier to interpret, traders rely on technical trading indicators that can measure it. RSI indicator (Relative Strength Index) is one of the most widely used indicators for this purpose, helping to evaluate the speed and strength of recent price movements.
Through this article, we will explore RSI in depth, covering how it is calculated, its standard settings, key trading signals, its strengths and weaknesses, and how it works in combination with other technical tools and indicators.
What is RSI Indicator?
The Relative Strength Index (RSI) is a momentum oscillator that measures the speed and magnitude of recent price movements by comparing the average gains to the average losses over a specified period. It oscillates between 0 and 100, helping traders assess buying and selling momentum and identify potential overbought, oversold, and divergence conditions.
RSI generally works best in ranging or sideways markets, where it can more effectively identify overbought and oversold conditions. In strong trending markets, RSI may remain in overbought or oversold for extended periods, making trend confirmation and additional technical tools important.
As RSI is described as a momentum oscillator, what do those terms actually mean? Let’s break them down.
- Momentum: measures how quickly and strongly prices are changing. Unlike a trend, which focuses on the market’s direction, whether prices are moving up, down, or sideways, momentum on the other hand measures the strength behind that movement.
- Oscillator: is a category of technical indicators that fluctuates within a defined range or around a central value rather than directly following price. The Relative Strength Index (RSI) is a well-known oscillator that moves between 0 and 100, helping traders identify momentum extremes such as overbought and oversold conditions, as well as potential changes in market behaviour.
With a clear understanding of what RSI measures, let’s briefly explore the history behind this classic momentum indicator and how it was developed.
History Glimpse:
The Relative Strength Index (RSI) was developed by J. Welles Wilder Jr. and introduced in 1978 in his book, New Concepts in Technical Trading Systems. Wilder created RSI to provide traders with a systematic way to measure the speed and strength of price movements, helping identify momentum shifts as well as potential overbought and oversold conditions. During the 1980s and 1990s, as personal computers and charting software became more widely available, RSI was incorporated into many technical analysis platforms, making it accessible to traders.
Today, it is one of the most widely used momentum indicators across stocks, forex, commodities, cryptocurrencies, and other financial markets, and is included by default on every modern trading platform.
Every RSI value plotted on your chart is the result of a mathematical calculation based on recent price movements. Here is a breakdown of how those values are calculated.
How is RSI Calculated?
RSI indicator is calculated by comparing the average gains to the average losses over a specified period, typically 14 periods. The result is then converted into a value between 0 and 100, which represents the strength of recent price momentum.
The standard RSI formula, introduced by J. Welles Wilder Jr., is:
RSI = 100 – (100 / 1+ RS)
- RS = Average Gain /Average Loss.
- Average Gain = Average of all upward price changes over the selected period (typically 14 periods).
- Average Loss = Average of all downward price changes over the selected period (typically 14 periods).
As you have probably noticed, the calculation repeatedly refers to a 14-period l. But why 14 periods? Let’s explore why the 14-period setting became the standard and when traders may choose to adjust it.
What is the Standard RSI Period?
The standard period for the Relative Strength Index (RSI) introduced by J. Welles Wilder Jr is 14 periods. This means the RSI indicator calculates momentum using the last 14 candles on the selected timeframe.
Example:
On a 1-hour chart, RSI uses the 14-hours candles, while on a daily chart RSI uses the last 14 daily candles.
This setting is the default on most charting platforms and is widely used because it works well for most trading styles and provides a balanced measure of price momentum without being too sensitive or too slow.
Some traders adjust the period depending on their trading style:
- Shorter periods, such as 7 or 9, are more responsive to price changes, making them suitable for short-term traders like day traders and scalpers, but they may also generate more false signals.
- Longer periods like 21 or 25 provide smoother RSI readings with fewer false signals, making them popular with swing traders and long-term investors but they react more slowly to changes in price momentum.
Besides the standard period, RSI also has standard reference levels that traders use to interpret its overbought and oversold readings.
What are the Standard RSI Levels?
The standard RSI levels introduced by J. Welles Wilder Jr are:
- 70: The default overbought level.
- 30: The default oversold level.
These default levels are widely used on most charting platforms. However, some traders adjust the levels to better suit different market conditions or trading strategies.
For example:
In strong trends, some traders use 80/20 instead of 70/30 during strong trends to help filter out false reversal signals.
With the fundamentals of RSI covered, let’s look at why traders rely on this indicator in their market analysis.
Why Do Traders Use RSI?
- Measures momentum by showing the speed and strength of recent price movements.
- Helps identify potential entry and exit points when used alongside other technical analysis tools.
- Identifies overbought and oversold conditions, helping traders anticipate possible changes in price direction.
- Detects bullish and bearish divergences, which may indicate weakening momentum and potential price reversals.
- Enhances trade analysis when combined with price action, moving averages, or other trend indicators.
The benefits of RSI become more useful when you know how to understand and read its signals. Let’s explore the main RSI trading signals and what they can reveal about market momentum.
What are the Main RSI Trading Signals?
The following are the most common RSI indicator trading signals that traders use to interpret momentum and identify potential trading opportunities.
1. Overbought & Oversold:
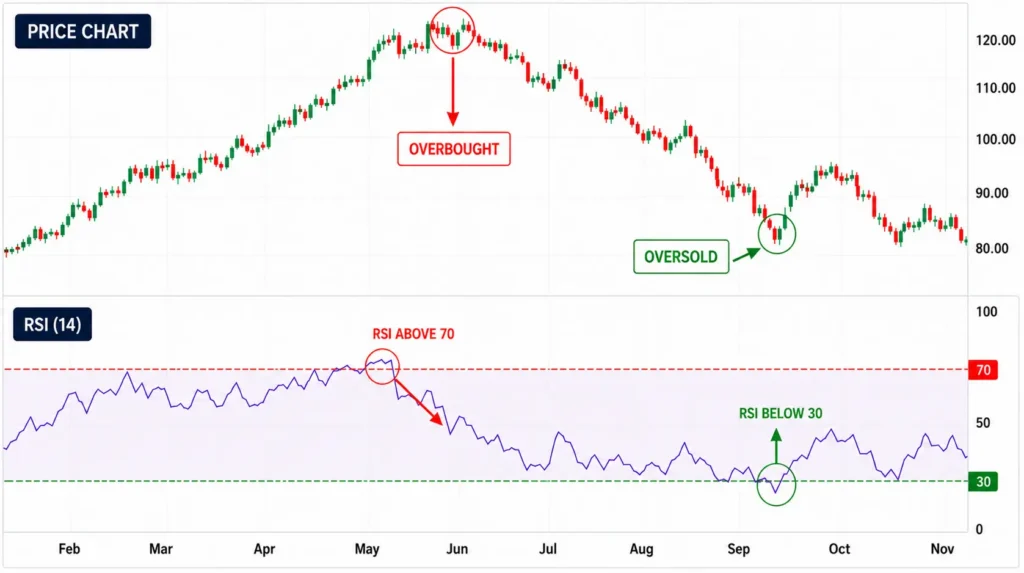
Overbought and oversold are among the most popular RSI signals, helping traders identify when price movements may have become overextended and momentum may start to weaken, increasing the likelihood of a pullback or rebound.
- Overbought: Usually occurs when RSI rises above 70, signalling strong buying pressure in recent price movements. However, bullish momentum may start to fade as the move becomes overextended, increasing the possibility of a pullback.
- Oversold: Usually occurs when RSI drops below 30, signalling strong selling pressure in recent price movements. However, bearish momentum may start to fade as the move becomes overextended, increasing the possibility of a rebound.
2. Divergence:
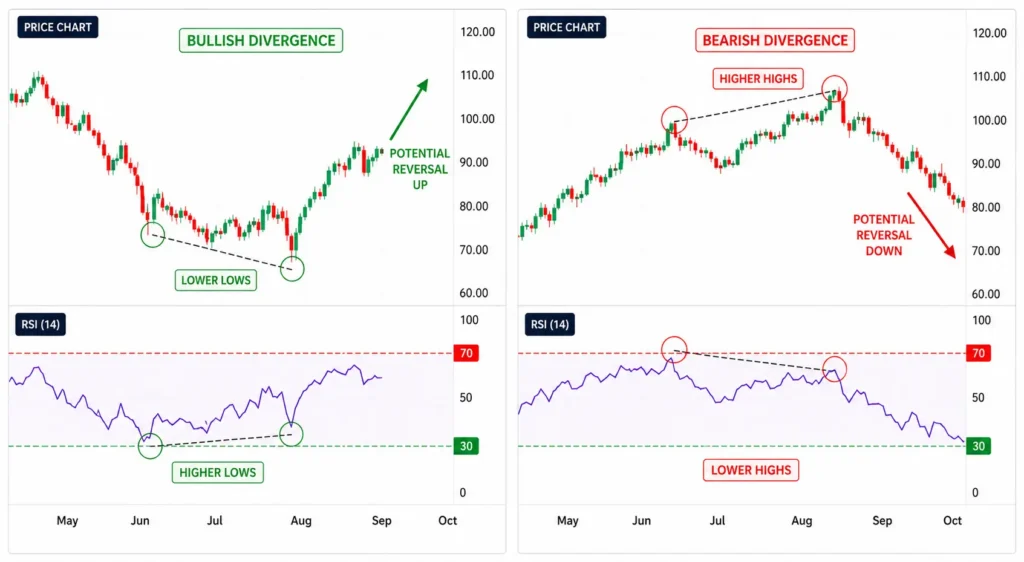
Divergence is one of the powerful RSI signals. It occurs when price and RSI move in opposite directions, signalling that the momentum behind the current price movement is weakening and that a potential reversal or slowdown may follow.
- Bullish divergence: Price makes lower lows while RSI makes higher lows. This indicates that although price is still falling, the selling momentum is weakening, which may signal a potential upward reversal.
- Bearish divergence: Price makes higher highs while RSI makes lower highs. This indicates that although price is still rising, the buying momentum is weakening, which may signal a potential downward reversal.
3. The Centreline (50 Level):
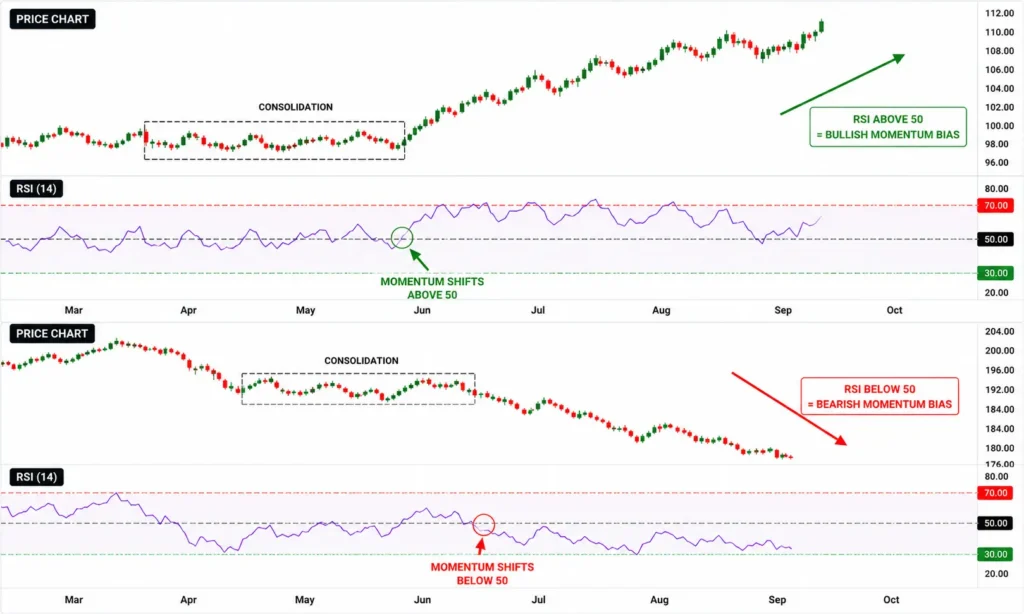
The RSI 50 level serves as a midpoint filter to identify the prevailing momentum bias. A crossover above or below the 50 level may signal a potential shift in market momentum.
- RSI above 50: Indicates that bullish momentum is dominant, signalling that buyers are in control and supporting the possibility of continued upward price movement.
- RSI below 50: Indicates that bearish momentum is dominant, signalling that sellers are in control and supporting the possibility of continued downward price movement.
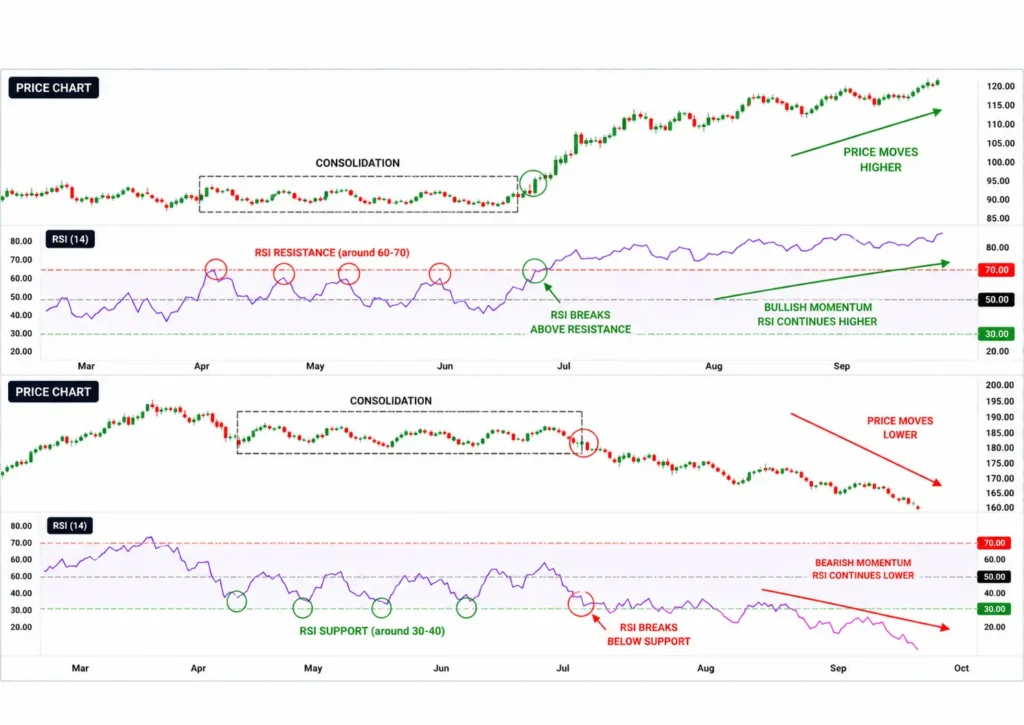
4. RSI Breakouts:
Traders can draw trendlines and identify support and resistance levels directly on the RSI. A breakout above resistance or below support may signal strengthening momentum, which may precede a price breakout.
- Bullish RSI breakout: RSI breaks above a key resistance level. This reflects strengthening bullish momentum, which may lead to an upward price move.
Example:
RSI has been stuck below 60, which has been acting as resistance. RSI suddenly breaks above 60, indicating that buying pressure is increasing. Even if price hasn’t broken resistance yet, momentum already has. Price often follows with an upward move.
- Bearish RSI breakout: RSI breaks below a key support level. This reflects strengthening bearish momentum, which may lead to a downward price move.
Example:
RSI has been holding above 40, which has been acting as a support level. RSI suddenly breaks below 40, indicating increasing selling pressure. Even if price hasn’t broken support yet, momentum already has. Price often follows with a downward move.
Like any technical indicator, RSI is most effective when used correctly. Understanding the common pitfalls can help traders avoid costly trading mistakes and improve their analysis.
What are the Common Pitfalls Traders Make When Using RSI?
- Treating every overbought and oversold reading as an automatic sell or buy signal, while ignoring the fact that in a strong trend, the RSI can remain above 70 or below 30 for extended periods, which may result in premature entries.
- Many traders focus only on overbought and oversold readings while overlooking RSI divergence, one of the indicator’s most valuable signals for identifying weakening momentum and potential price reversals.
- Using the RSI 50 centreline as a standalone entry signal. The 50 level helps identify the prevailing momentum bias, but it should be used alongside trend analysis and other technical confirmations rather than as an entry signal.
- Applying RSI without considering whether the market is in an uptrend or downtrend often leads to trading against the prevailing trend. For example, overbought in an uptrend may reflect strong bullish momentum rather than a possible shift.
- Relying solely on RSI without confirming signals from other technical indicators, trend analysis, candlestick patterns or support and resistance levels can increase the likelihood of false signals.
- Ignoring risk management and relying on RSI signals without using appropriate stop-loss orders, take-profit levels and position sizing can result in big losses.
- Using the same RSI settings for every market and timeframe. Different markets and trading styles may require adjustments to the RSI period or to the overbought and oversold levels to improve signal reliability.
By avoiding these common mistakes, traders can use RSI more effectively. It is also important to understand the indicator’s pros and cons.
What are the Pros and Cons of RSI?
No technical indicator is perfect, and RSI is no exception. Understanding its pros and cons provides a more balanced view of its strengths and weaknesses.
| Pros of RSI | Cons of RSI |
| Easy to interpret, the RSI is simple to read, with clear levels such as 30, 50, and 70. | RSI can remain overbought or oversold for extended periods during strong trending markets, which can mislead traders. |
| Helps traders assess the strength and direction of price momentum. | Divergence may indicate weakening momentum well before price responds, potentially causing traders to enter or exit positions too early. |
| Identifies overbought and oversold conditions, which highlight when an asset may be overextended and potentially due for a correction or rebound. | Lagging by nature, since RSI is calculated from past price data, it reacts to price rather than predicting it, meaning signals can arrive late. |
| Detects divergence which can provide early warning signs that momentum is weakening before a potential reversal. | Does not identify the trend on its own, RSI measures momentum rather than the overall market trend and should be used alongside trend-following tools. |
| Customisable, the RSI settings, including the calculation period and overbought or oversold levels, can be adjusted to suit different trading strategies. | RSI alone is not sufficient for making trading decisions and must be combined with price action, trend analysis or other indicators to improve accuracy. |
After exploring the pros and cons of RSI, it’s important to understand how to use it effectively in real trading. RSI is most reliable when combined with other technical analysis tools rather than used on its own.
How to Combine RSI with Other Technical Tools and Indicators?
RSI should not be used as a standalone trading indicator. While it provides valuable insights into momentum and potential reversal points, combining it with other technical analysis tools helps confirm signals, filter out false signals and improve trading decisions.
1. RSI with MACD:
Both are momentum indicators but measure momentum differently. RSI helps identify momentum extremes, while MACD helps identify changes in momentum and the direction of the prevailing trend. Using both together can improve confidence in trading signals.
Example:
If RSI rises above 70 while MACD forms a bearish crossover, traders may view the combined signals as stronger confirmation that bullish momentum is weakening.
2. RSI with Moving averages (MA):
MA helps identify the prevailing trend, while RSI measures the strength of price momentum. Combining both helps traders focus on RSI signals that align with the overall trend, reducing the likelihood of taking counter-trend trades.
Example:
If the price is trading above the 200-day moving average and RSI rebounds from below 30, traders may view this as a stronger signal that the uptrend could resume.
Note:
A commonly used multi-indicator strategy among traders is to combine RSI, Moving Averages, and MACD to evaluate trend direction, momentum, and trade timing. Since each indicator provides complementary information, using them together can help traders make more informed trading decisions.
3. RSI with Bollinger Bands:
Bollinger Bands help identify potential volatility extremes. When combined with RSI, traders can better assess whether a price move may be becoming overextended.
Example:
If the price touches the upper Bollinger Band while RSI rises above 70, traders may consider this confluence as a stronger signal of a potential pullback.
4. RSI with Support and Resistance:
Support and resistance levels identify key price zones where reversals may occur. When RSI reaches overbought or oversold conditions near an important support or resistance level, the signal may carry greater weight.
Example:
If the price reaches a major support level while RSI falls below 30, traders may interpret this as a stronger signal of a potential bullish reversal.
5. RSI with Candlestick Patterns:
Candlestick patterns help identify potential market reversals or continuations based on price action. When combined with RSI, they provide stronger confirmation of whether momentum supports the observed price movement.
Example 1:
If a bullish engulfing candle forms while RSI begins rising from oversold level, traders may consider it stronger confirmation of a potential upward move.
Example 2:
If a shooting star candlestick forms while RSI begins falling from overbought, traders may consider it a stronger confirmation of a potential downward move.
Now that we have explored how RSI can be combined with other technical tools, let’s take a closer look at one of its most popular counterparts, MACD, and the key differences between the two indicators.
What are the Differences Between RSI and MACD?
As RSI and MACD are two of the most popular momentum indicators in technical analysis, understanding the key differences between them helps traders choose the right tool for analysing market conditions and generating trading signals.
| Points of Comparison | RSI | MACD |
| Purpose | Measures the speed and magnitude of recent price movements to evaluate momentum. | Measures the relationship between two moving averages to assess trend direction, momentum, and potential trend changes. |
| Category | Momentum oscillator (Oscillates from 0 to 100) | Hybrid trend-following and momentum indicator (oscillates around a zero line) |
| Calculation | Based on average gains and losses over a specified period (default: 14). | Difference between the 12-period EMA and 26-period EMA. A 9-period EMA of the MACD line forms the signal line. |
| Main Components | Single RSI line | MACD line, Signal line, Histogram and Zero line. |
| Chart Placement | Plotted in a separate indicator window below the price chart. | Plotted in a separate indicator window below the price chart. |
| Scale | Fixed scale from 0 to 100. | No fixed upper or lower limits, values fluctuate above and below zero. |
| Centreline | 50 Level | Zero line |
| Default Period Settings | 14 | 12,26,9 |
| Ease of Usage | Easier due to its fixed 0–100 scale. | Slightly more complex because it requires interpreting multiple components. |
| Market Conditions | Works better in range-bound or sideways markets, though it can also help assess momentum in trending markets. | Works better in trending markets, where identifying trend direction and momentum is more important. |
| Key signals | Overbought/oversold levels and divergence signals. | Crossovers, zero-line breaks, and histogram momentum shifts. |
Summary
Ultimately, RSI is more than just a line moving between 0 and 100; it is a lens into market momentum. Revealing when momentum is building or fading gives traders a structured way to interpret price behaviour. When used wisely alongside other tools, RSI becomes less of a signal generator and more of a guide to market psychology and momentum flow.
