What Are Moving Averages?
Moving Averages are among the most commonly used indicators in trading. They help smooth out price data by showing the average price of a stock, currency, or asset over a specific time period. This makes it easier to identify the general direction of the market, whether it is trending up, down, or moving sideways.
In fast-moving markets, prices can change rapidly and unpredictably. Moving Averages help reduce this noise and give traders a clearer view of the overall market trend. They are a core part of technical analysis and are also useful for identifying support and resistance levels.
Why Use Moving Averages in Trading?
In fast-moving markets, prices can change rapidly — making it hard to tell if a trend is forming or fading. Moving averages help solve this by showing a smoothed line that follows price action over time.
They also help traders:
- Spot momentum shifts
- Time entries and exits
- Confirm breakouts and reversals
Types of Moving Averages (MAs)
There are different types of Moving Averages, each calculated using a slightly different method. However, the most common ones that are frequently used include:
- Simple Moving Average (SMA) – Calculates the average closing price over a set number of periods. Each price is given equal weight. It’s easy to understand and great for spotting overall trends.
- Exponential Moving Average (EMA) – Gives more importance to recent prices, so it reacts faster to market changes. This makes it popular with short-term traders looking for quicker signals.
- Weighted Moving Average (WMA) – Applies specific weights to each price point, with more recent prices getting higher weight. It offers even more control than EMA and is useful in volatile markets.
These types use slightly different formulas of moving average, helping traders decide how to calculate moving averages based on their strategy. Each can highlight trends and help identify key support and resistance levels.
Of all these types, the Simple Moving Average (SMA) is often the first one every trader will learn. It’s easy to calculate, widely used, and forms the foundation for understanding how moving averages work in technical analysis. Let’s take a closer look at how the SMA works and why it’s so effective for spotting market direction.
Moving Averages Formula
Each type of moving average uses a slightly different formula. Choosing the right one depends on your trading style and how responsive you want your indicator to be.
Simple Moving Average (SMA):

This is the most straightforward formula of moving average — just add the closing prices for a set number of periods, then divide by that number.
Exponential Moving Average (EMA):
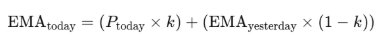
Where:

This formula places more weight on recent prices to respond faster to market changes.
Weighted Moving Average (WMA):

This version applies specific weights to each price, allowing more precision. Recent prices get the highest weight.
These formulas help answer one of the most common trading questions: “how do you calculate moving averages?”
Traders focused on forecasting may also explore centred moving averages, which use a midpoint rather than trailing prices. These are more common in data analysis than real-time trading.
Simple Moving Averages in Trading
What is a Simple Moving Average?
A Simple Moving Average (SMA) is a widely used technical indicator that smooths out price data by calculating the average price of an asset over a specific number of periods, such as days, hours, or minutes.
By averaging prices, it helps traders identify trends and potential reversals by filtering out short-term price fluctuations. As such, the SMA reduces the “noise” caused by random price fluctuations, making it easier for traders to see the underlying trend and potential turning points.
Understanding Lag and Responsiveness for SMA
The Simple Moving Average (SMA) is a lagging indicator, which means it’s based on past prices and reacts more slowly to recent market changes. This helps reduce “noise” from random price swings and makes trends clearer. However, it also means the SMA may signal trend changes a little later than some other indicators.
Shorter SMAs, like the 10-day, respond faster to price moves but can give more false signals. Longer SMAs, like the 200-day, react more slowly but tend to be more reliable for spotting long-term trends.
How is SMA calculated?
SMA is calculated by averaging the closing prices of an asset over a set number of periods (e.g., 10 days).
For example:
- Add up the closing prices of the last 10 days.
- Divide by 10 to get today’s SMA value.
- As each new day ends, the oldest price is dropped and the newest is added to update the average.
This creates a smooth line on the chart that moves with price.
Examples of SMA periods:
- SMA (10): Averages the last 10 closing prices and is considered a short-term moving average. It reacts quickly to recent price changes, making it useful for capturing short-term momentum.
- SMA (20): Averages the last 20 closing prices, providing a view of the medium-term trend.
- SMA (50) or (200): Longer-term averages that smooth out more fluctuations and highlight the broader trend over weeks or months.
SMA vs EMA: What’s the Difference?
As you begin using moving averages in your trading, it’s helpful to understand the key differences between the two most popular types — the Simple Moving Average (SMA) and the Exponential Moving Average (EMA). While both are used to identify trends and smooth price data, they behave a little differently.
| Feature | Simple Moving Average (SMA) | Exponential Moving Average (EMA) |
| Calculation | Averages all closing prices equally over the chosen period | Weights recent prices more heavily |
| Reactivity | Slower to respond to price changes | Reacts faster to recent movements |
| Best For | Long-term trend analysis | Short-term signals and momentum shifts |
| Signal Stability | More stable, fewer false signals | More sensitive, but can be noisy |
| Common Use | Spotting broader trends | Capturing early trend shifts |
In simple terms:
- SMA gives you a smoother view of the market by treating all data equally.
- EMA helps you spot faster shifts by focusing more on what’s happening right now.
Understanding how each one reacts can help you decide which fits your trading style best.
Chart Breakdown Example

Figure 1: SMA 10 (Blue) and SMA 20 (Red) showing short- and long-term trends
In the chart above, we use two key Simple Moving Averages:
- SMA (10, close) – Blue Line: A faster-moving average that follows short-term price changes closely.
- SMA (20, close) – Red Line: A slower-moving average that smooths out longer-term price trends.
These moving averages help traders identify shifts in momentum and make more informed trading decisions. Let’s take a closer look at what’s happening on the chart with the below:
- Bearish Crossover – A Potential Sell Signal
“Bearish crossover, potential sell signal”
A bearish crossover occurs when the shorter SMA (10) crosses below the longer SMA (20). This suggests recent price momentum is weakening and may signal the start of a downward trend.
Traders often view this crossover as a sell signal, particularly when it appears after a strong price rally or in overbought conditions — as it may indicate a reversal is on the horizon.
- Strategic Entry After Retracement
“Sell here after retrace back to the SMA”
Rather than selling immediately at the point of the crossover, experienced traders wait for a retracement, a short-term move back toward the SMA zone before opening a position.
In this example:
- The bearish crossover occurs.
- The price drops in response.
- Then, the price pulls back upward, retracing toward the moving averages.
- This retracement offers a cleaner and lower-risk opportunity to enter a short trade — often with a better entry price and a tighter stop-loss.
Popular Moving Average Strategies
- Golden Cross: A positive (bullish) signal that happens when a short-term moving average (for example, the 50-day moving average) moves above a long-term moving average (like the 200-day moving average). It suggests that prices may be starting a strong upward trend.
- Death Cross: A negative (bearish) signal where the short-term moving average falls below the long-term moving average. It indicates that prices might be entering a downward trend.
Traders watch these signals closely to mark important shifts in market direction.
Combine with Other Indicators
To improve the reliability of moving average signals, many traders use them alongside other technical indicators. These combinations help confirm trends, reduce false signals, and provide better timing.
- RSI (Relative Strength Index): Measures how fast and far prices have moved. RSI helps identify overbought (potential reversal down) and oversold (potential reversal up) conditions — making it useful for confirming signals from moving average crossovers.
- MACD (Moving Average Convergence Divergence): A momentum indicator based on two EMAs. It shows when momentum is shifting by analysing the relationship between short- and long-term trends. MACD is great for spotting trend strength and potential reversals.
- Bollinger Bands: These plot two lines around a moving average to show volatility. When prices touch or break the bands, it can signal potential breakouts or pullbacks. Combining Bollinger Bands with MAs helps traders spot entry points during high or low volatility.
Key Takeaways
- Crossovers between fast and slow SMAs can signal trend changes.
- Bearish crossover: Short SMA crosses below the long SMA → Possible downtrend.
- Bullish crossover: Short SMA crosses above the long SMA → Possible uptrend (not shown here, but works the same way in reverse).
- Retracements offer strategic entry points after signals, improving trade timing.
Pro Tip: Use Moving Averages Wisely
Moving averages work best in trending markets where prices move clearly up or down. In ranging or sideways markets, crossovers can produce false signals, causing whipsaws and confusion. Always confirm moving average signals with other indicators or price action to improve accuracy and avoid common pitfalls.