What are the key financial ratios? Normally, if you are considering investing in a company’s stocks or bonds, you first need to understand how financially healthy the company is before pooling any investments. And because financial data provides measurable insights, financial ratios are the perfect tool to unlock key insights about a company’s financial stability, profitability, and growth potential.
In this article, we will explore the different types of financial ratios and their importance to investors. So, let’s begin by first understanding what exactly are financial ratios?
What are financial ratios?
Financial ratios are simply numerical calculations that use a company’s financial figures to evaluate its overall performance, operational efficiency, and long-term financial strength.
The financial figures are usually extracted from the company’s financial statements, including the income statement, balance sheet, and cash flow statement, and are then used to calculate financial ratios.
In financial markets, financial ratios are mainly used by stock and bond investors to evaluate companies and investment risk.
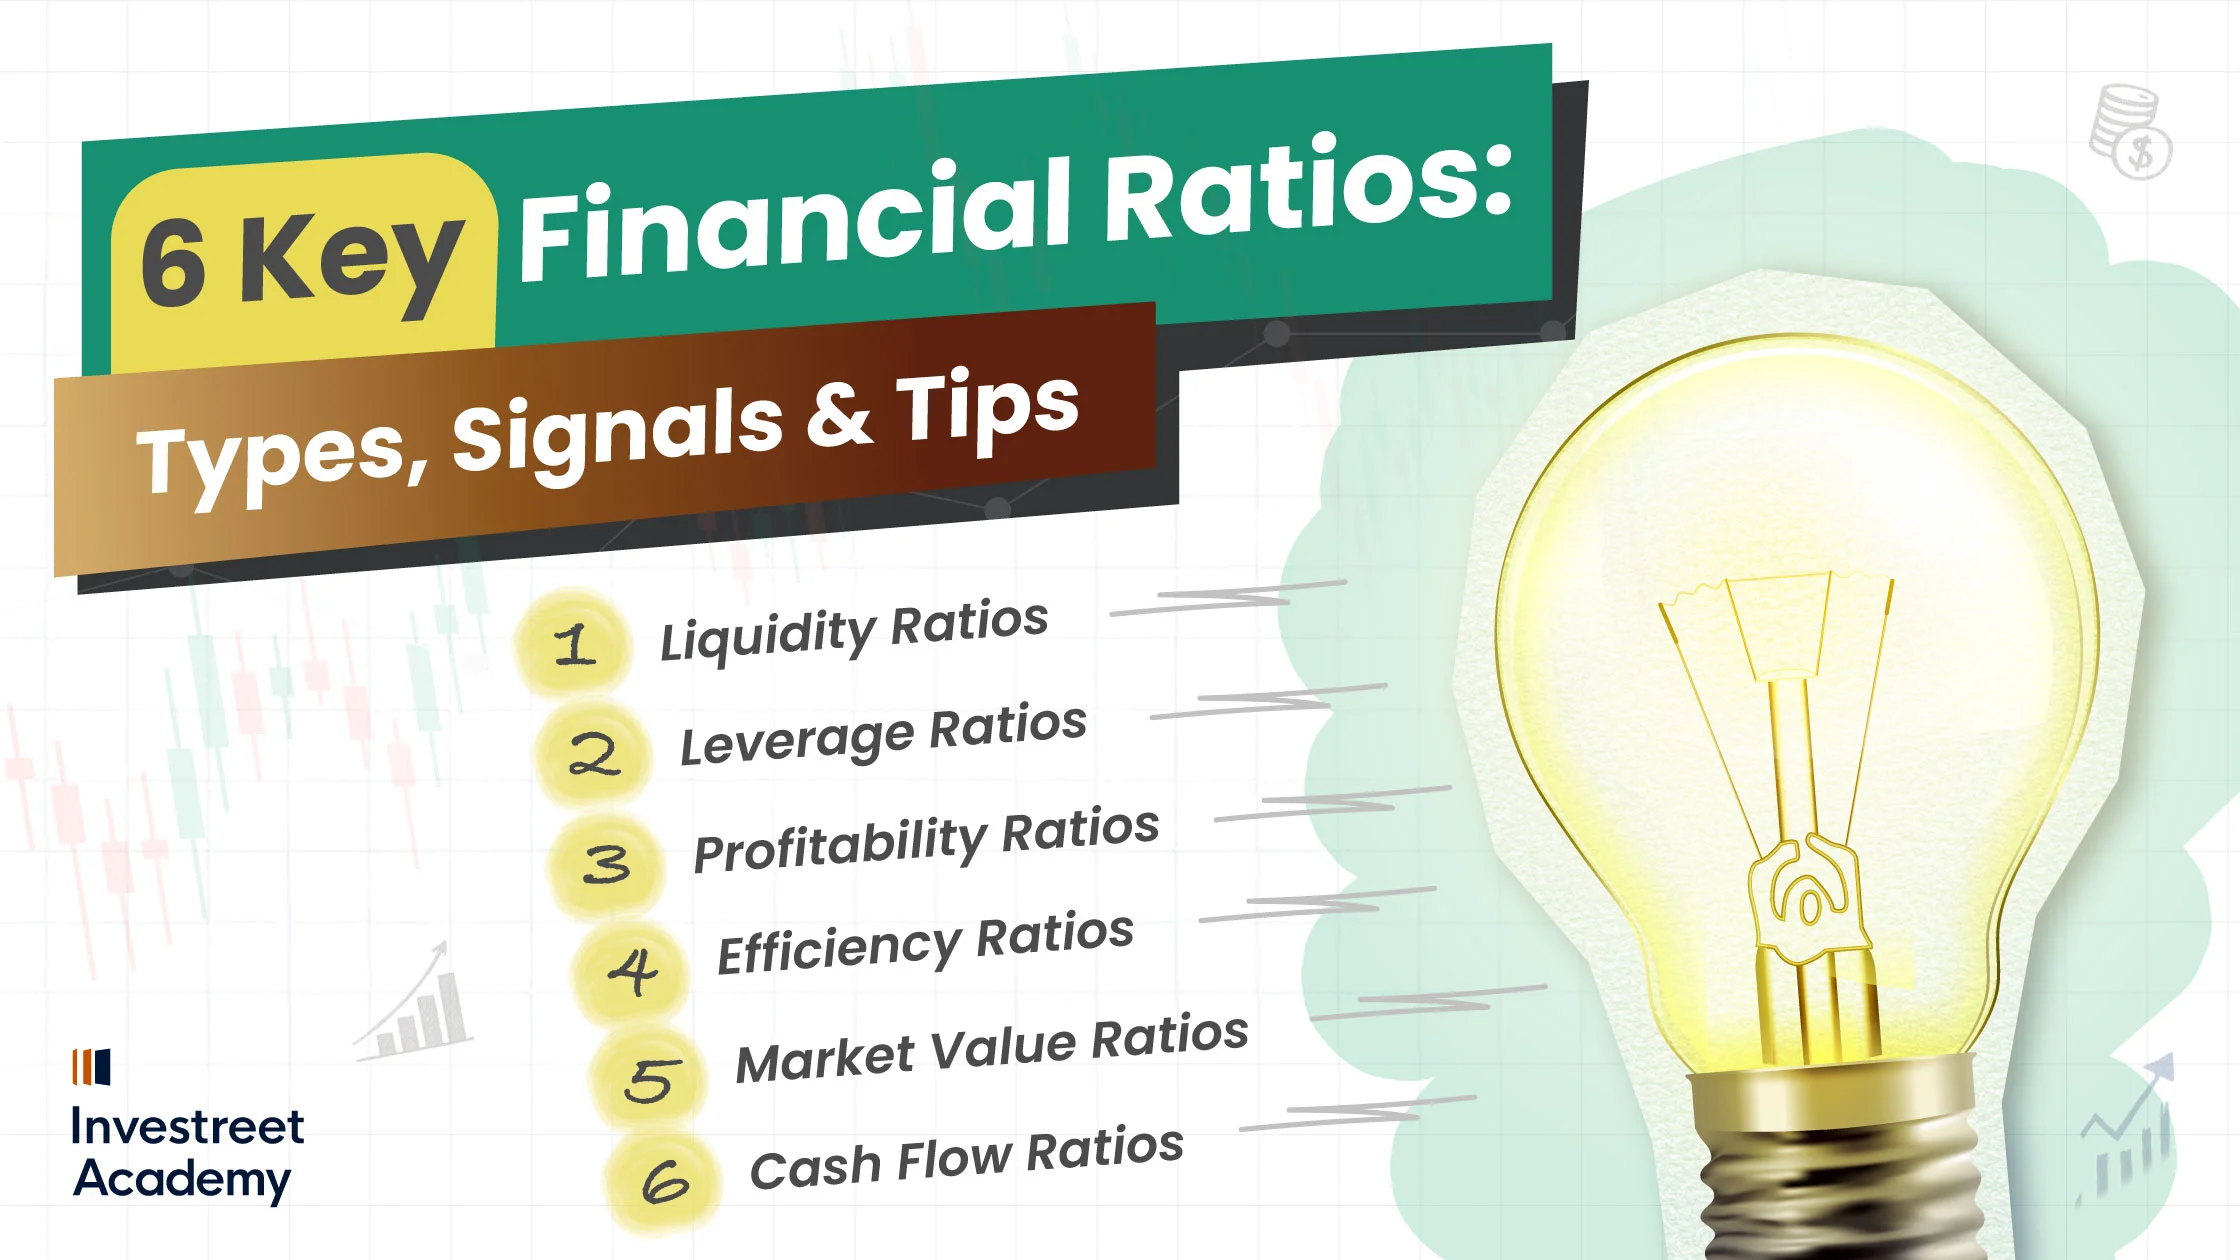
There are six main categories of financial ratios that unlock a deep understanding of the company’s performance and its position among competitors, these are:
Liquidity Ratios, Profitability Ratios, Leverage (Solvency) Ratios, Efficiency (Activity) Ratios, Market Value Ratios, and Cash Flow & Growth Ratios.
Have you ever wondered why financial ratios are important for investors, and whether they’re really worth exploring when making investment decisions? Let’s see…
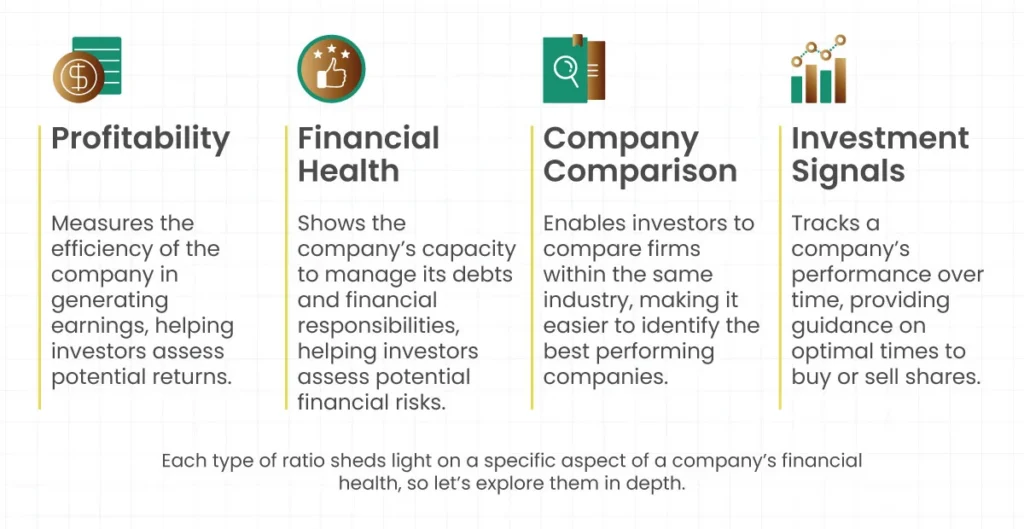
Why financial ratios matter to investors?
Financial ratios are key tools that help investors make informed decisions, providing broad insights into various aspects of a company’s performance.
However, financial ratios should be used alongside qualitative analysis and industry comparisons, as no single ratio provides a complete investment picture.
here are the list of ratios:
What are the different types of financial ratios?
Let’s take a closer look at each type to understand its purpose and see the calculation formulas.
1. Liquidity Ratios:
Liquidity ratios indicate a company’s ability to meet its short-term obligations and debts on time without incurring cash-flow problems.
High ratios signal that the company has strong liquidity, while a ratio below 1 may indicate liquidity pressure, depending on the industry
There are two key ratios used to measure the company’s liquidity: the Current Ratio and the Quick Ratio. They are calculated as follows:
A- Current Ratio = Current Assets / Current Liabilities
Example:
Current assets of $150,000 / current liabilities of $100,000 = Current Ratio of 1.5.
A ratio of 1.5 indicates the company is liquid and can cover its short-term debts. If the ratio were less than 1, it would indicate potential liquidity issues.
B- Quick Ratio = (Current Assets – Inventory) / Current Liabilities
2. Leverage (Solvency) Ratios:
Leverage Ratios are used to assess the financial stability of the company on a long-term scale and the extent of its reliance on debts to finance its operations.
A highly leveraged company signals higher risk to investors, whereas low leverage indicates greater financial stability.
There are two key ratios used to measure a company’s solvency: the Debt to Equity Ratio and the Interest Coverage Ratio. They are calculated as follows:
A- Debt to Equity (D/E) Ratio: measures the proportion of debt compared to shareholders’ equity.
= Total Debt / Shareholder’s Equity
High D/E means the company relies a lot on debts (high risk) while low D/E means the company has less debt (low risk)
B- Interest Coverage Ratio: shows how easily a company can pay interest from its operating profit (EBIT)
= EBIT (Earnings Before Interest and Taxes) / Interest Expense
High ICR means the company can easily cover interest (low risk) while low ICR means the company may struggle to pay interest (high risk).
3. Profitability Ratios:
Profitability Ratios are used to evaluate how efficiently a company generates profits from its sales, assets, or shareholders’ equity.
High ratios signal that the company is efficient in generating profits, while low ratios may suggest high costs, weak profitability, or operational inefficiencies.
There are three key ratios used to measure the company’s profitability: the Net Profit Margin, Return on Equity (ROE) and Return on Assets (ROA). They are calculated as follows:
A- Net Profit Margin: shows the percentage of revenue converted to profit.
= Net Income / Revenue x 100
B-Return on Equity (ROE): shows how efficiently the company uses shareholder funds to generate profit
= Net Income / Shareholder’s Equity
C- Return on Assets (ROA): measures the asset allocation efficiency to generate profit
= Net Income / Total Assets
4. Efficiency (Activity) Ratios:
Efficiency ratios are used to assess how well a company manages its operations and utilizes its assets. They reflect the effectiveness of the company’s internal management.
High turnover ratios indicate efficient operations, while low turnover ratios may signal operational inefficiencies.
There are three key ratios used to measure the company’s efficiency: Inventory Turnover, Asset Turnover and Accounts Receivable Turnover. They are calculated as follows:
A- Inventory Turnover: shows how quickly the inventory is sold.
= Cost of Goods Sold / Average Inventory
B- Asset Turnover: shows how efficiently assets generate revenue.
= Revenue / Average Total Assets
C- Accounts Receivable Turnover: measures how fast the company collects money from customers.
= Net Credit Sales / Average Accounts Receivable
5. Market Value Ratios
Market value ratios show how investors value a company compared to its financial performance, helping stock market investors judge whether a company’s shares are attractive.
They help compare stocks, inform investment decisions, and shape market sentiment about the company’s future growth.
There are three key ratios used to measure the company’s market value: Price to Earnings (P/E) Ratio, Earnings Per Share (EPS) and Price-to-Book (P/B) Ratio. They are calculated as follows:
A- Price to Earnings (P/E) Ratio: investors will expect growth with a high P/E while a low P/E may indicate undervaluation or weak growth expectations
= Share Price / Earnings Per Share (EPS)
B- Earnings Per Share (EPS): shows profit per share, making it useful for stock valuation.
= Net Income / Number of Outstanding Shares
C- Price-to-Book (P/B): compares market price to net assets per share.
= Share Price / Book Value per Share
6. Cash Flow (Growth) Ratios:
Cash Flow or Growth Ratios show how well a company generates cash and its potential to grow as profit alone doesn’t always mean the company has healthy cash flow.
There are two key ratios used to measure the company’s growth: Operating Cash Flow Ratio and EPS Growth Rate. They are calculated as follows:
A- Operating Cash Flow Ratio: measures the ability to pay short term obligations using cash.
= Operating Cash Flow / Current Liabilities
B- EPS (Earning Per Share) Growth Rate: measures growth in earnings per share over time.
= (Current EPS – Previous EPS) / Previous EPS × 100
Strong cash flow signals that the company has high investment opportunities and capable of paying dividends, speaking of the growth ratios Positive growth may indicate expansion potential but should be assessed alongside other metrics.
As we have gone through a lot of information on financial ratios. Let’s make a simple side by side table so you can easily grasp the differences between all the types.
The Key differences between financial ratios
| Ratio Type | Purpose | Key Ratios | Ratios Signals |
| Liquidity | Ability to pay short term debts. | Current Ratio & Quick Ratio | High: strong liquidityLow (<1): possible liquidity problems |
| Leverage (Solvency) | Long term financial stability & the reliance degree on debt. | Debt to Equity (D/E) & Interest Coverage Ratio (ICR) | High D/E: high riskLow D/E: low riskHigh ICR: low riskLow ICR: high risk |
| Profitability | Efficiency in generating profit. | Net Profit Margin, ROE & ROA | High: profitableLow: not profitable and cost issues |
| Efficiency (Activity) | How well assets and operations are managed. | Inventory Turnover, Asset Turnover & Accounts Receivable Turnover | High: efficient operationsLow: operational inefficiencies |
| Market Value | How investors value the company. | P/E Ratio, EPS & P/B Ratio | High P/E: growth expectedLow P/E: undervalued or slow growthHigh EPS: growth expectedP/B > 1: valued above bookP/B <1: possibly undervalued |
| Cash Flow (Growth) | Cash flow generation and growth potential. | Operating Cash Flow Ratio & EPS Growth Rate | High: strong cash generation and growth potentialLow: limited cash and slower growth |
Finally, if you want to make smarter investment decisions, financial ratios should not be overlooked, as they reveal a company’s true potential from multiple perspectives. By analyzing these ratios, investors can identify strengths, spot weaknesses, and make informed investment choices.