One of the biggest challenges in trading is determining whether a market pullback is simply a temporary pause or the beginning of a larger reversal. Fibonacci Retracement is a technical indicator used to identify potential support and resistance levels where a correction may pause or end, and where the prevailing trend may resume.
This article explores the key concepts behind Fibonacci Retracement, including its origins, core levels, practical applications, and role in technical analysis. We will also discuss how to use it effectively, combine it with other tools, avoid common pitfalls, and set it up on popular trading platforms such as MT4 and MT5.
What is Fibonacci Retracement?
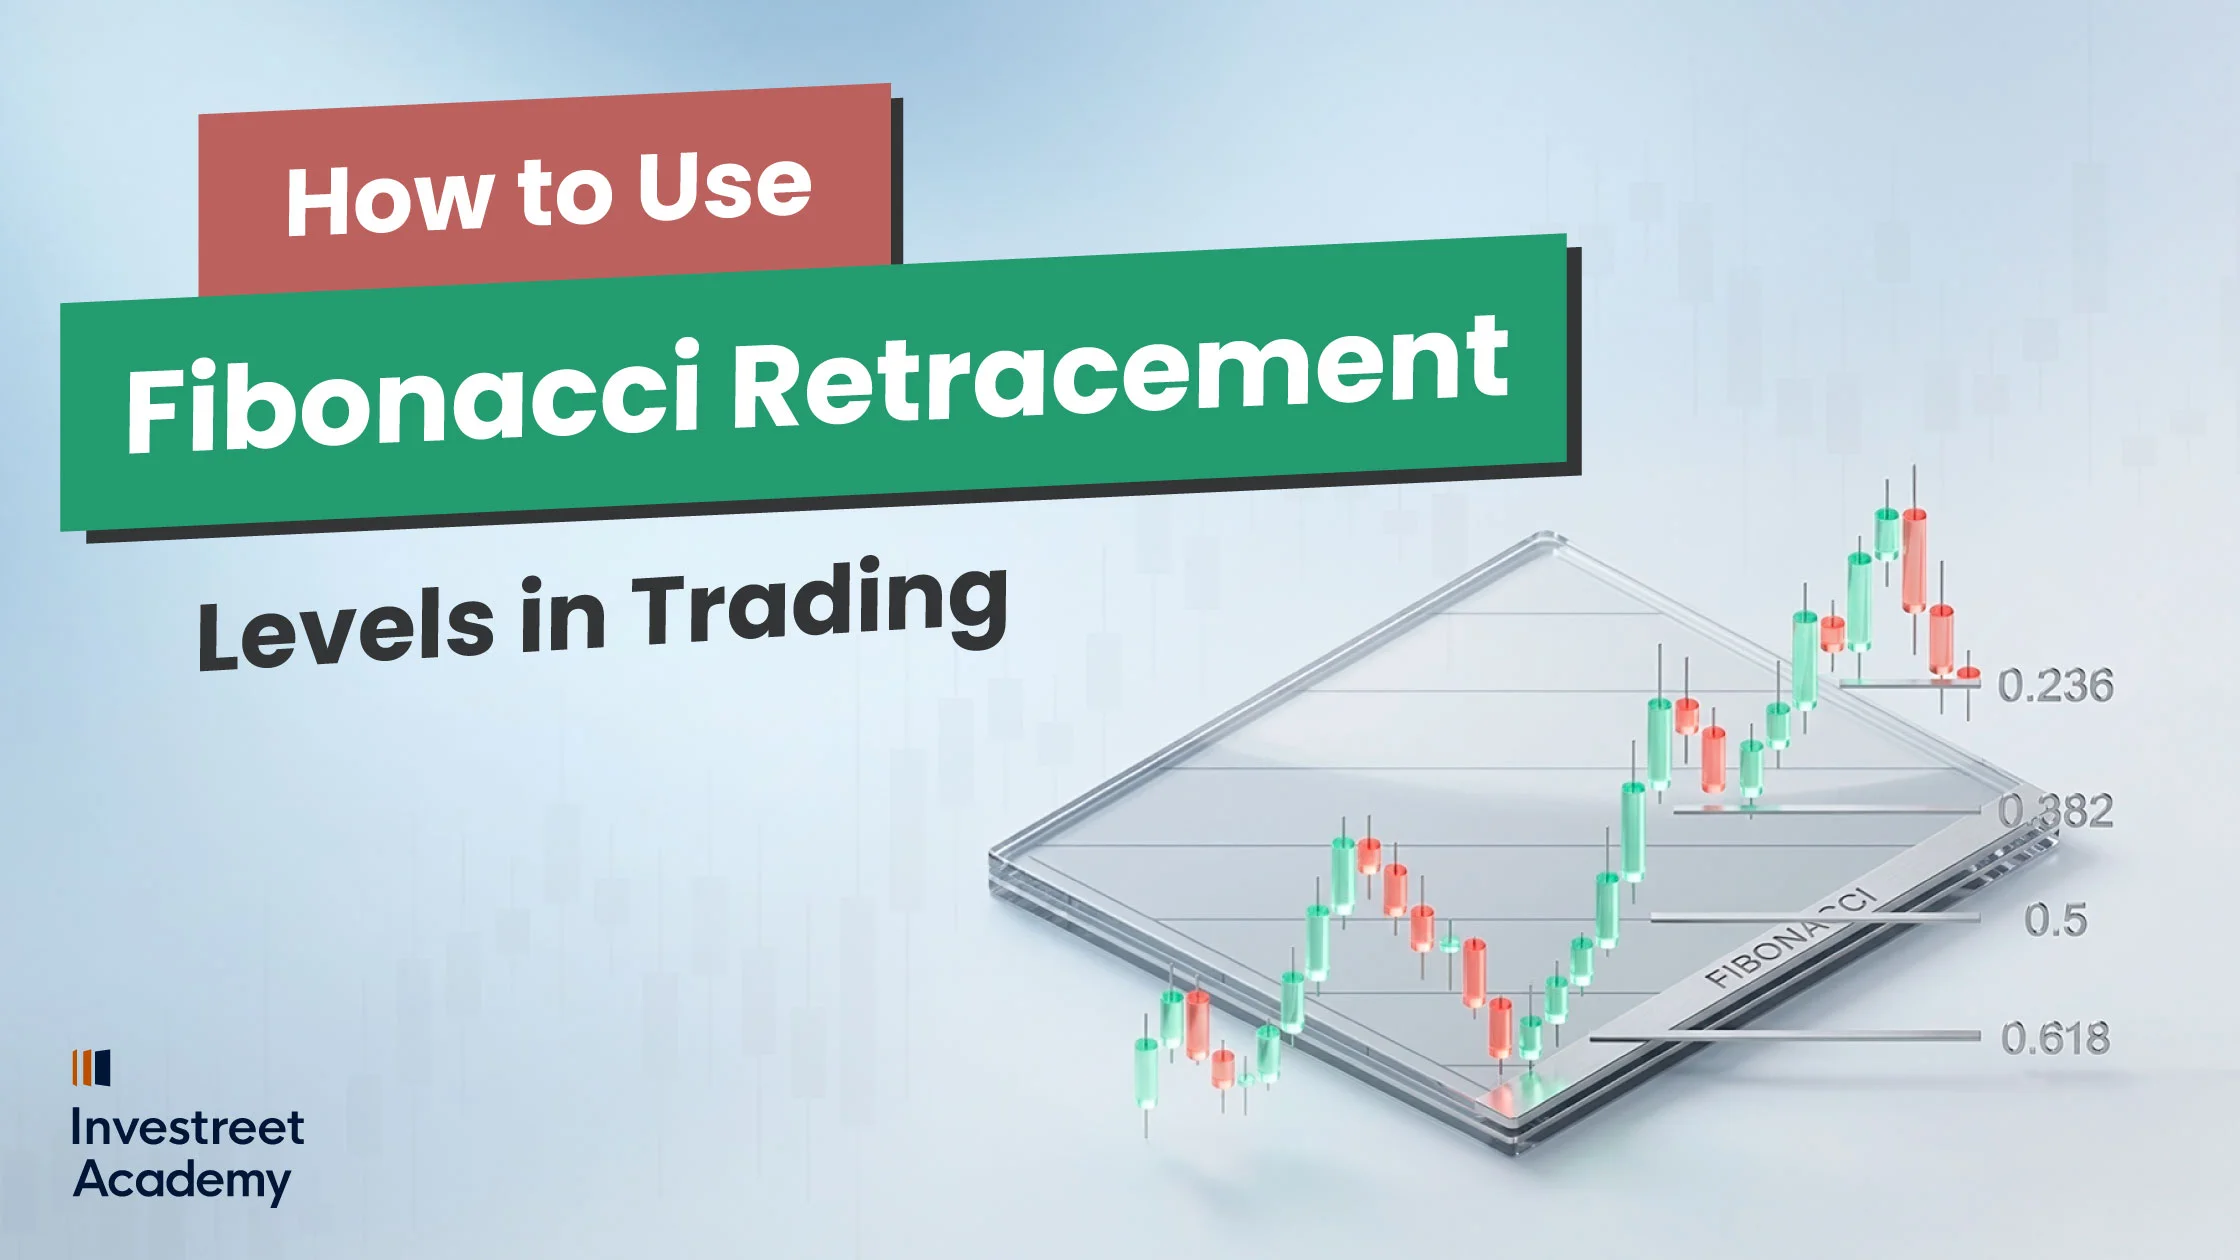
Fibonacci Retracement is a technical analysis tool that plots horizontal levels based on key Fibonacci ratios, such as 23.6%, 38.2%, 50%, 61.8%, 78.6% and 100%, between a significant swing high and a swing low. These levels help traders identify potential support and resistance areas where price may pause, reverse, or resume the prevailing trend.
Traders draw the Fibonacci tool between a significant swing high and swing low. It then plots a series of horizontal percentage-based levels that measure how much of the previous price move has been retraced. Higher Fibonacci levels indicate deeper pullbacks, helping traders assess whether the retracement is relatively shallow or deep compared with the preceding trend.
Before exploring Fibonacci Retracement in more detail. Let’s first take a glimpse into the history behind the Fibonacci sequence from which these ratios are derived.
A Brief History of Fibonacci Retracement
Fibonacci retracement is derived from the Fibonacci sequence, introduced by Italian mathematician Leonardo Fibonacci in the 13th century. The sequence follows a simple pattern: 0, 1, 1, 2, 3, 5, 8, 13, 21, 34…, where each number is the sum of the two preceding numbers. As the sequence progresses, key ratios such as 61.8%, 38.2%, and 23.6% emerge.
These ratios were later adopted by technical analysts in the 20th century and became widely used in financial markets to identify potential support and resistance levels, measure the depth of market pullbacks, and anticipate where a trend may resume after a retracement.
Now that we have explored the history behind Fibonacci Retracement, let’s take a closer look at the key Fibonacci Retracement levels used by traders today.
What are Key Fibonacci Retracement Levels?
As we mentioned earlier the key Fibonacci Retracement levels are 23.6%, 38.2%, 50.0%, 61.8%, and 78.6%. Traders use these levels to identify potential support and resistance areas where a market pullback may pause, reverse, or resume the prevailing trend.
- 23.6%: A shallow retracement that often reflects a strong trend, with price pulling back only slightly before resuming its direction.
- 38.2%: A moderate retracement that often occurs in healthy trends. When price retraces to this level and resumes its original direction, it may signal the trend remains intact.
- 50%: A psychological midpoint; not a true Fibonacci ratio but widely respected by traders. It represents a retracement of half the previous price move and is often monitored as a potential support or resistance level.
- 61.8%: The Golden Ratio and one of the most closely watched Fibonacci levels, price often finds strong support or resistance here before resuming the prevailing trend.
- 78.6%: A deep retracement that reflects strong counter trend pressure. Holding this level may support trend continuation, while a break may signal a reversal.
Each of these levels provides a different perspective on the depth of a market retracement. But why do traders pay such close attention to them?
How Fibonacci Ratios are Derived:
- The Golden Ratio (61.8%): Calculated by dividing any number in the sequence by the number that follows it (e.g., $21 / 34 = 0.6176$).
- The 38.2% Level: Calculated by dividing any number in the sequence by the number two places to its right (e.g., $21 / 55 = 0.3818$).
Why Traders Use Fibonacci Retracement?
Traders use Fibonacci Retracement to identify potential price reaction zones and improve their market analysis. The tool can help with finding support and resistance levels, confirming trade setups, spotting entry opportunities, and managing risk.
- Identify potential support and resistance levels: In an uptrend, these levels may act as support during pullbacks, while in a downtrend, they may act as resistance during rebounds.
- Confirm trade setups: Traders often combine Fibonacci retracement levels with other technical indicators, such as RSI, moving average, trendlines, or candlestick patterns, to strengthen the reliability of trading signals.
Example:
If the price retraces to a key Fibonacci level while the RSI exits oversold territory and a bullish candlestick pattern forms, traders may view the combination of signals as stronger confirmation that the uptrend could resume.
- Spot entry opportunities: Traders use price retracements to key Fibonacci levels, particularly 38.2%, 50%, and 61.8%, to identify potential entry points in the direction of the prevailing trend.
Example:
If a currency pair is in an uptrend and retraces to the 61.8% Fibonacci level, a trader may enter a long position after the price bounces from that level, expecting the uptrend to continue.
- Manage risk and stop losses placement: Traders often place stop-loss orders beyond key Fibonacci levels. If price breaks through a Fibonacci level, it may suggest that the level has failed to hold as support or resistance, helping traders limit potential losses if the market moves against their trade.
Example:
If a trader enters a long position near the 61.8% retracement level, they may place a stop-loss below that level. A break below the 61.8% level may indicate that the expected support has failed to hold, helping the trader limit potential losses if the market continues to move lower.
Understanding why traders use Fibonacci levels is only part of the picture. The widespread popularity of Fibonacci Retracement has also led many traders to ask why markets often react to these levels.
Why do Markets React to Fibonacci Levels?
While there is no definitive explanation, several theories attempt to explain why markets may react to Fibonacci levels.
- Self-fulfilling prophecy: Millions of traders worldwide monitor the same Fibonacci retracement levels. When enough participants place buy or sell orders around these levels, their collective actions can influence price movements. Therefore, Fibonacci levels may work partly because traders expect them to.
- Human psychology: Financial markets are driven by human emotions such as fear and greed. Because traders often react similarly to price movements and market conditions, Fibonacci levels may become areas where buying or selling increases. Many traders consider levels such as 38.2%, 50%, and 61.8% important retracement zones that can trigger price reactions around these areas.
Whether Fibonacci levels work because of market psychology, trader behavior, or other factors, accurate application begins with selecting the correct swing points.
What are Swing Highs and Swing Lows in Fibonacci Retracement?
Before applying Fibonacci Retracement, traders must first identify the key price swings they want to measure. This involves locating the swing high and swing low, which represent the most important turning points in the selected price movement.
The swing high and swing low should be selected from a clear trending market. In an uptrend, traders typically measure from the swing low to the swing high, while in a downtrend, they measure from the swing high to the swing low.
Swing high: A temporary peak formed when price reaches a high point and then starts to decline. On a chart, it is typically identified by a candle whose high exceeds the highs of the surrounding candles.
Example: If GBP/USD rises from 1.3000 to 1.3200 and then starts falling, 1.3200 is the swing high.
Swing Low: A temporary bottom formed when price reaches a low point and then starts to rise. On a chart, it is typically identified by a candle whose low is lower than the lows of the surrounding candles.
Example: If GBP/USD falls to 1.3000 and then starts rising, 1.3000 is the swing low.
It is important to accurately identify the swing high and swing low, as the reliability of the Fibonacci levels depends on the selected price swing.
Identifying the correct swing high and swing low is the foundation of Fibonacci Retracement. Once these points are established, traders can use them to draw the tool and identify key retracement levels. Let’s explore the steps involved in applying Fibonacci Retracement on a chart.
How to Use Fibonacci Retracement On Chart?
Once the trend and key swing points have been identified, Fibonacci Retracement can be used to highlight potential support and resistance levels, as well as trend continuation. The following steps explain how traders typically use the tool on a chart.
Step 1: Identify the Overall Market Trend
Fibonacci retracement works best in clear trending markets. Determine whether the market is making higher highs (uptrend) or lower lows (downtrend) before drawing anything.
Step 2: Locate Key Swing High and Swing Low Points
Find the major turning points on your chart. In an uptrend, the swing low is your start and swing high is your end. In a downtrend, the swing high is your start and swing low is your end.
Step 3: Draw the Tool from Left to Right
Select the Fibonacci tool on MT4/MT5. Always drag from left to right across the time axis to ensure the automated percentage levels plot correctly on the right side of the price action.

Step 4: Wait for Price Retracement and Signal Confirmation
Do not trade immediately when price touches a level. Wait for the price to pull back to key zones (38.2%, 50%, or 61.8%) and watch for a confirmation signal, such as a candlestick pin bar or an RSI reversal.
Step 5: Place Your Technical Stop-Loss
Manage your risk by placing a protective stop-loss just below the support level (for longs) or above the resistance level (for shorts), or alternatively beyond the original swing point.
The effectiveness of Fibonacci Retracement increases significantly when multiple technical signals align at the same price level. This concept, known as confluence, is the primary reason traders combine Fibonacci levels with other indicators.
How to Combine Fibonacci Retracement With Other Technical Tools and Indicators?
Many traders use Fibonacci Retracement alongside other indicators to seek confluence. When multiple technical signals point to the same price area, confidence in the setup may increase. Here are following examples:
- Fibonacci with Moving Averages: MAs help identify the prevailing trend, while Fibonacci retracement highlights potential pullback zones. When price retraces to a Fibonacci level near a key moving average, such as the 50- or 200-day, the area may attract greater attention from traders as a potential support or resistance zone.
Example:
If price pulls back to the 61.8% Fibonacci level while the 50-day moving average is located near the same price area, traders may view this confluence as a stronger signal that the trend could resume.
- Fibonacci with RSI (Relative Strength Index): RSI can help confirm whether a market is overbought or oversold near a Fibonacci level. When price reaches a key Fibonacci retracement level and RSI starts moving higher from oversold conditions or lower from overbought conditions, it may provide additional confirmation that the prevailing trend remains intact.
Example:
If price retraces to the 61.8% Fibonacci level while RSI rises from oversold territory, traders may view this as a stronger bullish signal.
- Fibonacci with Trendlines: Trendlines help identify the prevailing trend and potential support or resistance levels. When a Fibonacci retracement level is located near a trendline, traders may view the area as a stronger zone of interest due to the confluence of two technical tools.
Example:
EUR/USD rises from 1.1000 to 1.1200. After drawing a Fibonacci retracement, the 61.8% level is located at 1.1076. An upward sloping trendline connecting previous higher lows also passes near 1.1076. Because both the Fibonacci level and the trendline highlight the same price area, traders may view it as a stronger potential support zone.
- Fibonacci with Candlestick patterns: Candlestick patterns can help confirm whether price is reacting to a Fibonacci retracement level. Bullish patterns near Fibonacci support or bearish patterns near Fibonacci resistance may provide additional confirmation that buying or selling pressure is emerging at the level and that the prevailing trend may be ready to resume.
Example:
EUR/USD rises from 1.1000 to 1.1200 and then retraces to the 61.8% Fibonacci level. At that level, a bullish engulfing candle forms, indicating that buyers have stepped in and rejected lower prices. Traders may view this as a stronger bullish signal than the Fibonacci level alone.
So far, we have focused on how Fibonacci Retracement can help identify potential entry areas during a correction. However, traders also use Fibonacci Extension to estimate where price may move after the trend resumes.
What is the Difference Between Fibonacci Retracement and Fibonacci Extension?
Fibonacci Extension is a technical analysis tool used to estimate potential price targets beyond a previous high in an uptrend or below a previous low in a downtrend. It helps traders identify potential profit targets after a retracement is complete and the trend resumes.
It is based on two price swings and a retracement, using three points on a chart, the start of the initial move, the end of that move, and the end of the retracement.
The tool then plots extension levels such as 127.2%, 161.8%, 200%, and 261.8% to identify potential price targets beyond the previous high or low.
Unlike Fibonacci Retracement, Fibonacci Extension is drawn in the direction of the prevailing trend because it is used to estimate potential price targets once the retracement is complete and the trend resumes, it also estimates how far the next price move may continue in the direction of the trend.
So, let’s simply clarify the difference between Fibonacci Retracement and Fibonacci Extension through the following examples:
- Fibonacci Retracement: If a stock goes up from $10 to $100. Then it starts falling. Retracement levels are drawn within that $10–$100 range to help you spot where price might stop falling and bounce back. You’re looking for support within the original move.
- Fibonacci Extension: Now the stock bounced back up and is breaking past $100. Extension levels are drawn beyond the original $10–$100 range to help you predict how high it could go next. You’re looking for future profit targets outside the original move.
| Points of Comparison | Fibonacci Retracement | Fibonacci Extension |
| Purpose | Identify potential support and resistance levels, entry points, and stop-loss levels | Identify potential profit targets |
| Typical Use | During a correction or retracement | After a retracement, when the trend resumes |
| Common Levels | 23.6%, 38.2%, 50%, 61.8%, 78.6% | 127.2%, 161.8%, 200%, 261.8% |
| Plot points | 2 points: Swing high + swing low | 3 points: Swing low + swing high + retracement end |
| Direction of Plot | Drawn against the direction of the trend | Drawn with the direction of the trend |
| Risk Management Role | Used for stop-loss placement | Used for take-profit placement |
After exploring the key differences between Fibonacci Retracement and Fibonacci Extension, let’s take a look at the pros and cons of Fibonacci Retracement.
What are the pros and cons of Fibonacci Retracement?
Like any technical analysis tool, Fibonacci Retracement has both pros and cons. Understanding these strengths and weaknesses can help traders use the tool more effectively and avoid common mistakes.
| Pros | Cons |
| Simple to draw with just 2 points, once the swing points are correctly identified. | Can be subjective, as traders may choose different swing highs and swing lows. |
| Helps identify potential support and resistance levels. | Does not guarantee that price will reverse at a Fibonacci level. |
| Helps in finding potential entry and stop-loss levels. | Less reliable in choppy or sideways markets. |
| Works well alongside other technical indicators for stronger signals | Multiple Fibonacci levels can make it difficult to determine which level will hold. |
| Applicable across different markets and timeframes. | Can produce false signals without confirmation. |
While Fibonacci Retracement can be a valuable tool, its effectiveness often depends on how it is applied. Avoiding common mistakes can help traders use it more effectively.
What are Common Mistakes Traders Should Avoid When using Fibonacci Retracement?
- Selecting incorrect swing highs and swing lows or using random ones can lead to inaccurate levels.
- Applying Fibonacci Retracement without confirming the overall trend direction first or applying it in sideway markets.
- Assuming Fibonacci levels will always hold as support or resistance and guarantee a price reversal.
- Entering a trade the moment price touches a level without waiting for a confirmation signal.
- Relying solely on Fibonacci levels without combining it with other indicators like RSI, Moving Averages, or candlestick patterns.
- Not adjusting Fibonacci levels when a new more significant swing forms on the chart.
- Ignoring stop-loss placement and risk management, even when trading from strong Fibonacci levels.
- Overcomplicating the chart with too many Fibonacci levels, drawing Fibonacci Retracement from too many different swing points, creating a cluttered chart and conflicting signals.
Now that we have covered the key concepts, applications, and common mistakes associated with Fibonacci Retracement, let’s look at how to set up the tool on MT4 and MT5.
How to Set Up Fibonacci Retracement on MT4 and MT5?
| How to draw Fibonacci Retracement? | |
| MT4 | MT5 |
| Open your chart and identify a clear swing high and swing low. | |
| From the top menu → click Insert → Fibonacci → Retracement. | From the top menu → click Insert → objects → Fibonacci Tools → Fibonacci Retracement. |
| Draw the Fibonacci tool between the swing points: Drag from the swing low to the swing high in an uptrend, or from the swing high to the swing low in a downtrend. Release the mouse, and the Fibonacci levels will appear automatically. | |
| How to edit and customize Fibonacci Retracement level? | |
| MT4 | MT5 |
| Double-click the Fibonacci tool on the chart, then right-click and select Fibonacci Properties. | |
| A window will open with four tabs: Common: Customize the Fibonacci retracement’s (base line) appearance, including the colour, line style, and thickness of the line connecting the two swing points. Parameters: Manually adjust the start and end points of the Fibonacci retracement if needed using time and price values. Fibonacci Levels: Add, remove, or edit Fibonacci levels and their descriptions. You can also customize the appearance of the Fibonacci levels, such as their color and line style. Visualization: Choose which timeframes the Fibonacci retracement appears on. | |
Note:
The default Fibonacci levels may vary slightly depending on the platform configuration. Commonly used levels include 0.0%, 23.6%, 38.2%, 50.0%, 61.8%, and 100.0%. Many traders also add 78.6% as an additional retracement level.
While no technical indicator can predict market movements with certainty, Fibonacci Retracement remains one of the most widely used tools for analysing pullbacks and potential trend continuation areas. Used alongside confirmation signals and proper risk management, it can help traders make more informed trading decisions.
FAQ
Is Fibonacci Retracement accurate?
Answer: Fibonacci Retracement is not a crystal ball and does not predict the future with 100% accuracy. Instead, it highlights high-probability price reaction zones. Its accuracy increases significantly when a level aligns with other technical indicators, such as a 50-day moving average, a major trendline, or a horizontal support/resistance level. If used in isolation without confirmation, it can produce false signals.
Which Fibonacci Level is Strongest?
Answer: The 61.8% level (The Golden Ratio) and the 38.2% level are universally considered the strongest and most closely watched by institutional and retail traders.
- 38.2% usually holds firm in extremely strong, aggressive trends where buyers/sellers rush to enter early.
- 61.8% acts as the ultimate line in the sand for a healthy correction; if price breaks cleanly past 61.8%, it often signals a total trend reversal rather than a temporary pullback.
How do Traders use Fibonacci?
Answer: Traders primarily use Fibonacci tools for three tactical purposes:
- Entry Points: Waiting for the price to pull back to a key level (like 50% or 61.8%) and showing signs of rejection before entering in the direction of the main trend.
- Stop-Loss Placement: Placing protective stops just below (in an uptrend) or above (in a downtrend) the next Fibonacci level to limit risk if the setup fails.
- Profit Targets: Utilizing Fibonacci Extensions (such as 127.2% and 161.8%) to map out potential exit areas once the price breaks into new territory.
What Timeframe Works Best for Fibonacci?
Answer: Fibonacci Retracement is a fractal tool, meaning it works across all timeframes. However, higher timeframes like the Daily (D1), 4-Hour (H4), and 1-Hour (H1) are the most reliable. Higher timeframes filter out the “market noise” and choppy price action found on 5-minute or 15-minute charts, leading to cleaner swing highs/lows and stronger self-fulfilling price reactions.