
The Moving Average Convergence Divergence indicator (MACD) is a popular momentum indicator that helps traders spot changes in trend direction and strength. Simply put, it answers questions like: Is the market gaining momentum? Could a reversal be near?
The MACD was developed by Gerald Appel in the late 1970s. His goal was to create a tool that combines trend-following and momentum analysis in one indicator, giving traders a clearer and more dynamic picture of market conditions.
Unlike simple moving averages, which smooth price data evenly, the MACD combines trend-following and momentum analysis to give a clearer, more dynamic picture of market conditions.
What makes the MACD especially valuable is its versatility. It can be applied across various markets including forex, stocks, commodities, and indices. Despite its technical name, the MACD is relatively straightforward to interpret, making it a popular choice for both new and experienced traders. By understanding how the MACD lines and histogram interact, traders can gain clearer insights into price direction and momentum shifts.
What is the MACD?
The MACD works by comparing two different Exponential Moving Averages (EMAs) to show when momentum is increasing or slowing down. An EMA smooths price data but gives more weight to recent prices, so it ‘pays more attention’ to the latest moves than a simple moving average does.
The MACD has three key parts:
- MACD Line – The MACD Line is one of the most important parts of the MACD indicator. It helps traders understand if a trend is gaining or losing strength.
- When the MACD Line goes up, it means the price is moving higher and gaining momentum.
- When it goes down, it may signal that the trend is weakening or that a reversal could be coming.
The MACD Line is calculated by comparing two moving averages:
- A faster one that reacts quickly to price changes (12-period EMA)
- A slower one that smooths out short-term movements (26-period EMA)
The Formula:
MACD Line = EMA(12) − EMA(26)
This means the MACD Line shows the difference between the short-term and long-term price trends. When the short-term average moves above the long-term one, it often suggests growing bullish momentum—and vice versa for bearish moves.
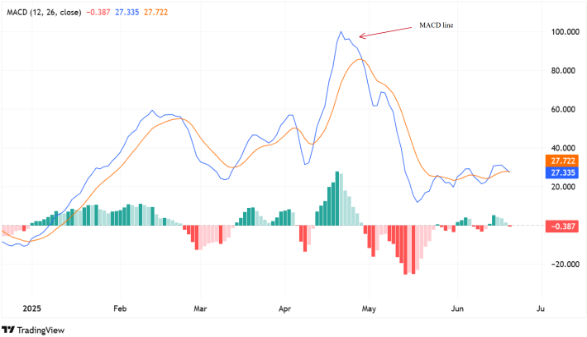
Figure 1: Example of MACD line
- Signal Line – The Signal Line is used to help identify when to enter or exit a trade. It works together with the MACD Line to highlight changes in market momentum.
- When the MACD Line crosses above the Signal Line, it may suggest that the market is turning bullish — a possible buy signal.
- When the MACD Line crosses below the Signal Line, it may point to a bearish shift — a possible sell signal.
The Signal Line is a 9-period Exponential Moving Average (EMA) of the MACD Line itself. In other words, it smooths out the MACD Line to make it easier to spot changes in direction.
The Formula:
Signal Line = EMA(9) of MACD Line
Think of the Signal Line as a slower moving trendline that helps confirm whether the momentum is strengthening or fading.
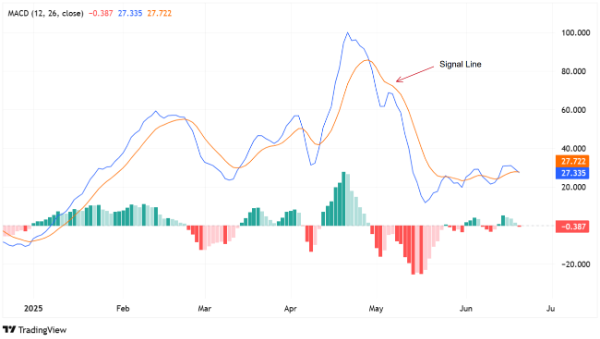
Figure 2: Example of Signal Line
- Histogram –The MACD Histogram is a bar chart that shows the difference between the MACD Line and the Signal Line. It gives you a quick, visual way to see how strong the market momentum is and whether it’s increasing or fading.
- Taller bars (in either direction) mean momentum is strong.
- Shorter bars mean momentum is weakening.
- When the bars cross the zero line, it can indicate a possible change in trend.
The histogram measures the gap between the MACD Line and the Signal Line. It expands when the lines move apart and shrinks when they move closer together.
The Formula:
Histogram = MACD Line − Signal Line
By looking at the histogram, traders can quickly spot when momentum is picking up or slowing down, even before a crossover happens.
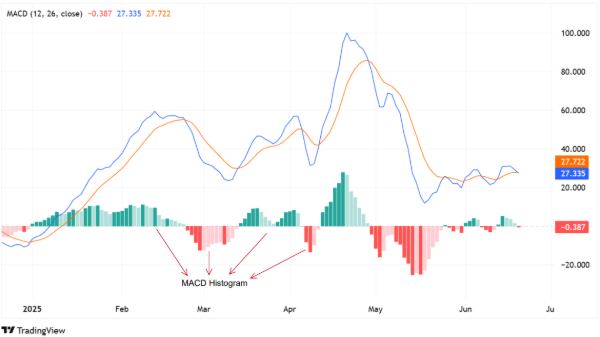
Figure 3: Example of MACD Histogram
Brief explanation of EMA weighting vs SMA for better understanding
Why Does MACD Use EMAs Instead of SMAs?
To understand the MACD, we first need to know a little bit about moving averages.
A moving average is a tool that smooths out price data so it’s easier to spot trends. There are two common types:
Simple Moving Average (SMA)
- Adds up prices over a period and divides by the number of days.
- All days are treated equally.
- Example: In a 10-day SMA, each day counts for 10%.
Exponential Moving Average (EMA)
- Similar to an SMA, but it gives more importance to recent prices.
- That makes it react faster to changes in the market.
Why it matters for MACD:
The MACD uses EMAs because they respond more quickly to price movement. This makes the MACD better at spotting changes in momentum — especially when trends are just beginning.
How Does MACD Work?
The MACD helps traders understand whether the market is gaining strength, slowing down, or changing direction. It does this by analysing how two moving averages interact, and by showing changes in momentum through crossovers, histogram bars, and the zero line.
Let’s break down the three main signals traders look for when using the MACD:
1. MACD Crossover – Spotting Momentum Shifts
One of the most common MACD signals is the crossover between the MACD Line and the Signal Line:
- When the MACD Line crosses above the Signal Line, it suggests bullish momentum — the price may move upward (a potential buy signal).
- When the MACD Line crosses below the Signal Line, it suggests bearish momentum — the price may start falling (a potential sell signal).
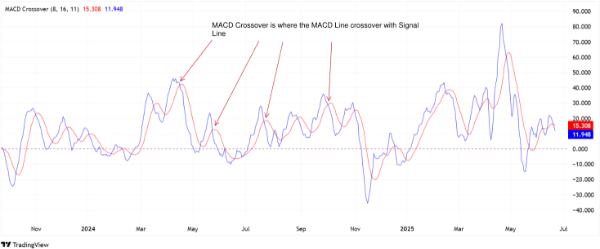
Figure 4: Example of MACD Crossover
Why it matters: Crossovers help traders catch early signs of trend changes.
2. Histogram Bars – Measuring Momentum Strength
The MACD histogram is a series of bars that show the difference between the MACD Line and the Signal Line. It gives a visual sense of how strong or weak the momentum is.
- When the bars are getting bigger, it means the two lines are moving further apart — momentum is increasing.
- When the bars are shrinking, the lines are getting closer — momentum is slowing down.
- If the bars are above the zero line, it often supports bullish conditions. Below the zero line, it leans bearish.
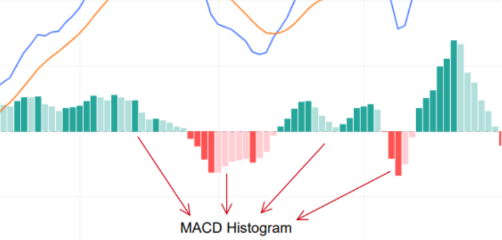
Figure 5: MACD Histogram
Why it matters: The histogram can show whether a trend is building strength or starting to lose steam, even before a crossover happens.
3. Zero Line Cross – Confirming Trend Direction
The zero line (also called the centreline) is a horizontal line on the MACD chart. It acts as a reference point for overall trend direction.
- When the MACD Line crosses above the zero line, it signals a shift toward positive (bullish) territory.
- When the MACD Line crosses below the zero line, it suggests a move into negative (bearish) territory.
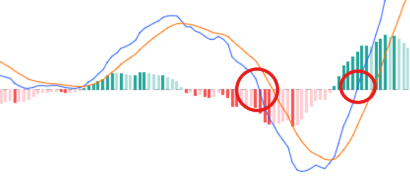
Figure 6: MACD Line crossing Zero-line
Why it matters: Zero-line crossovers help confirm the overall trend. Traders use them to stay in sync with the bigger market direction.
How to Trade Using MACD (and Combine It with RSI or Other Tools)
MACD is a powerful standalone indicator, but it becomes even more effective when used in combination with other tools. Here’s how traders typically apply MACD in real trading scenarios:
- Look for Clear Crossovers
Use MACD Line and Signal Line crossovers as potential entry or exit points. For example:
- Bullish signal: MACD Line crosses above Signal Line.
- Bearish signal: MACD Line crosses below Signal Line.
Wait for confirmation from other signals before placing a trade.
- Combine MACD with RSI
The Relative Strength Index (RSI) measures whether an asset is overbought or oversold. When combined with MACD:
- Buy confirmation: MACD bullish crossover + RSI rising from oversold levels.
- Sell confirmation: MACD bearish crossover + RSI falling from overbought levels.
This combination helps reduce false signals and improves timing.
- Use MACD with Support and Resistance
MACD signals are more reliable when they align with key price levels:
- Look for MACD crossovers near support for bullish trades.
- Look for bearish signals near resistance zones.
- MACD + Trendlines or Moving Averages
In trending markets, combining MACD signals with trendlines or moving averages (like the 50 or 200 EMA) adds another layer of confirmation. Use MACD to catch early momentum shifts, then validate with broader trend indicators.
Why Combine MACD With Other Indicators?
Using MACD with other tools adds context. While MACD shows momentum and trend shifts, RSI highlights overbought/oversold zones, and support/resistance confirms price action. This multi-layered approach gives traders a clearer edge.
Putting It All Together
When reading the MACD, traders often look for a combination of MACD strategies signals. For example, a bullish crossover combined with rising histogram bars and a zero-line cross can provide stronger confirmation for a buy opportunity.
By learning to interpret these signs step by step, even beginners can start using the MACD to make more informed trading decisions. With practice, interpreting these signals becomes easier, helping even beginners make smarter trading decisions.
Chart Breakdown Example
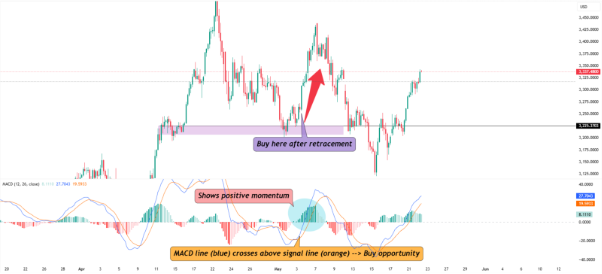
Figure 7: MACD Indicator Showing Bullish Crossover and Strategic Buy Setup
In this chart, the MACD is used to identify a potential buy signal:
- MACD Crosses Above Signal Line
MACD line (blue) crosses above signal line (orange) → Buy Opportunity
This crossover shows a change in momentum from bearish to bullish. It often happens near the bottom of a trend, giving traders an early signal that the price could start moving upward.
- Positive Momentum Builds (Histogram)
Shows positive momentum
As the histogram bars turn green and rise above the zero line, it confirms growing bullish strength. This gives traders more confidence to look for long opportunities.
- Strategic Entry After Retracement
Buy here after retracement
Rather than entering immediately on the crossover, skilled traders wait for a retest of support. In this case, a pullback to the highlighted zone. When the price holds and rebounds, it presents a lower-risk entry with a tighter stop-loss.
Key Takeaways
- The MACD helps spot momentum shifts and trend changes.
- A bullish crossover (MACD line crosses above signal line) may indicate a buy opportunity.
- Waiting for a retracement after the signal can improve trade timing and reduce risk.
- The histogram confirms momentum strength – growing bars suggest increasing confidence in the trend.
Pro Tip: Confirm with Other Tools
MACD is powerful, but no indicator is perfect. For best results, use MACD signals in combination with support/resistance zones, trendlines, or volume indicators. This helps filter out false signals and improves trade accuracy.